


The documentation of software is an everyday business of a software developer and engineer. Especially for integration scenarios a diagram on the flow of a message through the system or the whole landscape is an essential illustration. Fortunately there are standardised messaging patterns which can be used. Unfortunately, however, there is no tool which can create such visualizations out of the box directly of source code. In this article we will have a look at Apache Camel and how it is possible to get a graphical representation of an integration route. We will also discuss about debugging it, as some tools have the feature to do this.
The integration framework Apache Camel was created in 2008. Since then it was continuously developed and maintained. At the moment it is versatile useable not only in standard java applications, also on Quarkus or natively on Kubernetes. The documentation is quite good and a large community available on Zulip, stackoverflow.com or GitHub can help you if any challenge occurs.
As the framework is based on Enterprise Integration Patterns it is easy to find the best solution for nearly every integration scenario. Additionally, the implementation is straight forward as the documentation keeps an example for each pattern to be used with Apache Camel.
Here is a sample for a Apache Camel route:
from("jetty:http://0.0.0.0:8080/api").matchOnUriPrefix(true))
    .routeId("Step1")
    .removeHeaders("*", "breadcrumbId")
    .unmarshal().json(JsonLibrary.Jackson, Map.class)
    .process(extractInitialBodyProcessor)
    .to(seda("further_processing?waitForTaskToComplete=Never"))
    .setHeader(Exchange.HTTP_RESPONSE_CODE, constant(200))
    .setBody(constant(""));
For manual documentation purposes you can then either use the EIP icons in one of this diagramming applications or a web-based tool like Visual Paradigm Online.
Starting with tools to only create a diagram of a Camel route we will end up with more powerful.
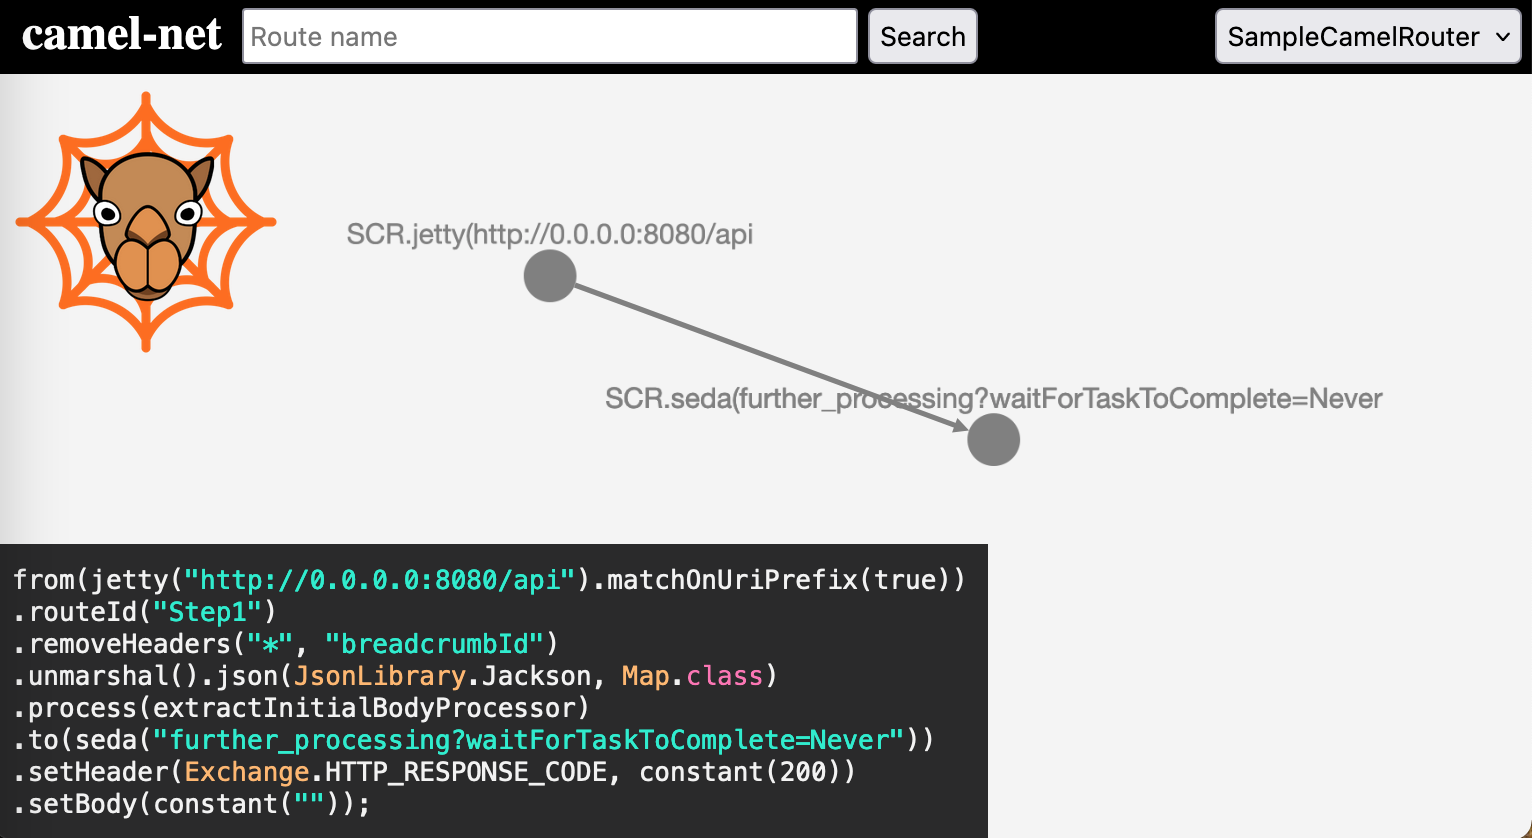
Camel-net parses the source code of an application and creates an interactive graph of the found routes which can be accessed through the started webserver.
Pros
+ complete decoupled of the application
+ you can see the route behind an element
Cons
- not everything is supported yet
- the graph contains the same data, but always looks slightly different
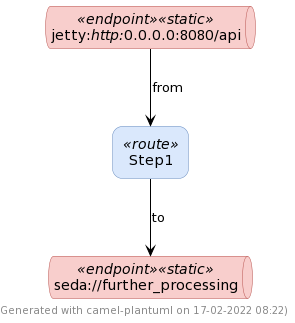
As the name already suggests a PlantUML code for a diagram will be generated with this tool. In order to use it you can either embed it to your application or connect remotely to it see detailed instructions on Github. No matter which way you use, you get the PlantUML code through a get request to the configured endpoint.
Pros
+ lightweight solution
+ you can add the resulting PlantUML code to your version control
+ possibility to connect remotely
Cons
- some other tool must be used to render the PlantUML code
The generated code for the image above was this:
@startuml SampleCamel

skinparam ArrowColor #Black

skinparam rectangle {
  RoundCorner 20
}

skinparam rectangle<<route>> {
  BorderColor #6C8EBF
  BackgroundColor #DAE8FC
}

skinparam queue<<endpoint>> {
}

skinparam queue<<static>> {
  BorderColor #B85450
  BackgroundColor #F8CECC
}

skinparam queue<<dynamic>> {
  BorderColor #82B366
  BackgroundColor #D5E8D4
}

footer Generated with camel-plantuml on %date("dd-MM-yyyy HH:mm")

' === Some useful settings for tweaking diagram layout ===
'left to right direction
'hide stereotype
'skinparam nodesep 50
'skinparam ranksep 50
'skinparam wrapWidth 250

rectangle route_1 <<route>> as "
Step1
"

queue endpoint_1 <<endpoint>><<static>> as "
jetty://http://0.0.0.0:8080/api
"

queue endpoint_2 <<endpoint>><<static>> as "
seda://further_processing
"

endpoint_1 --> route_1 : from

route_1 --> endpoint_2 : to

@enduml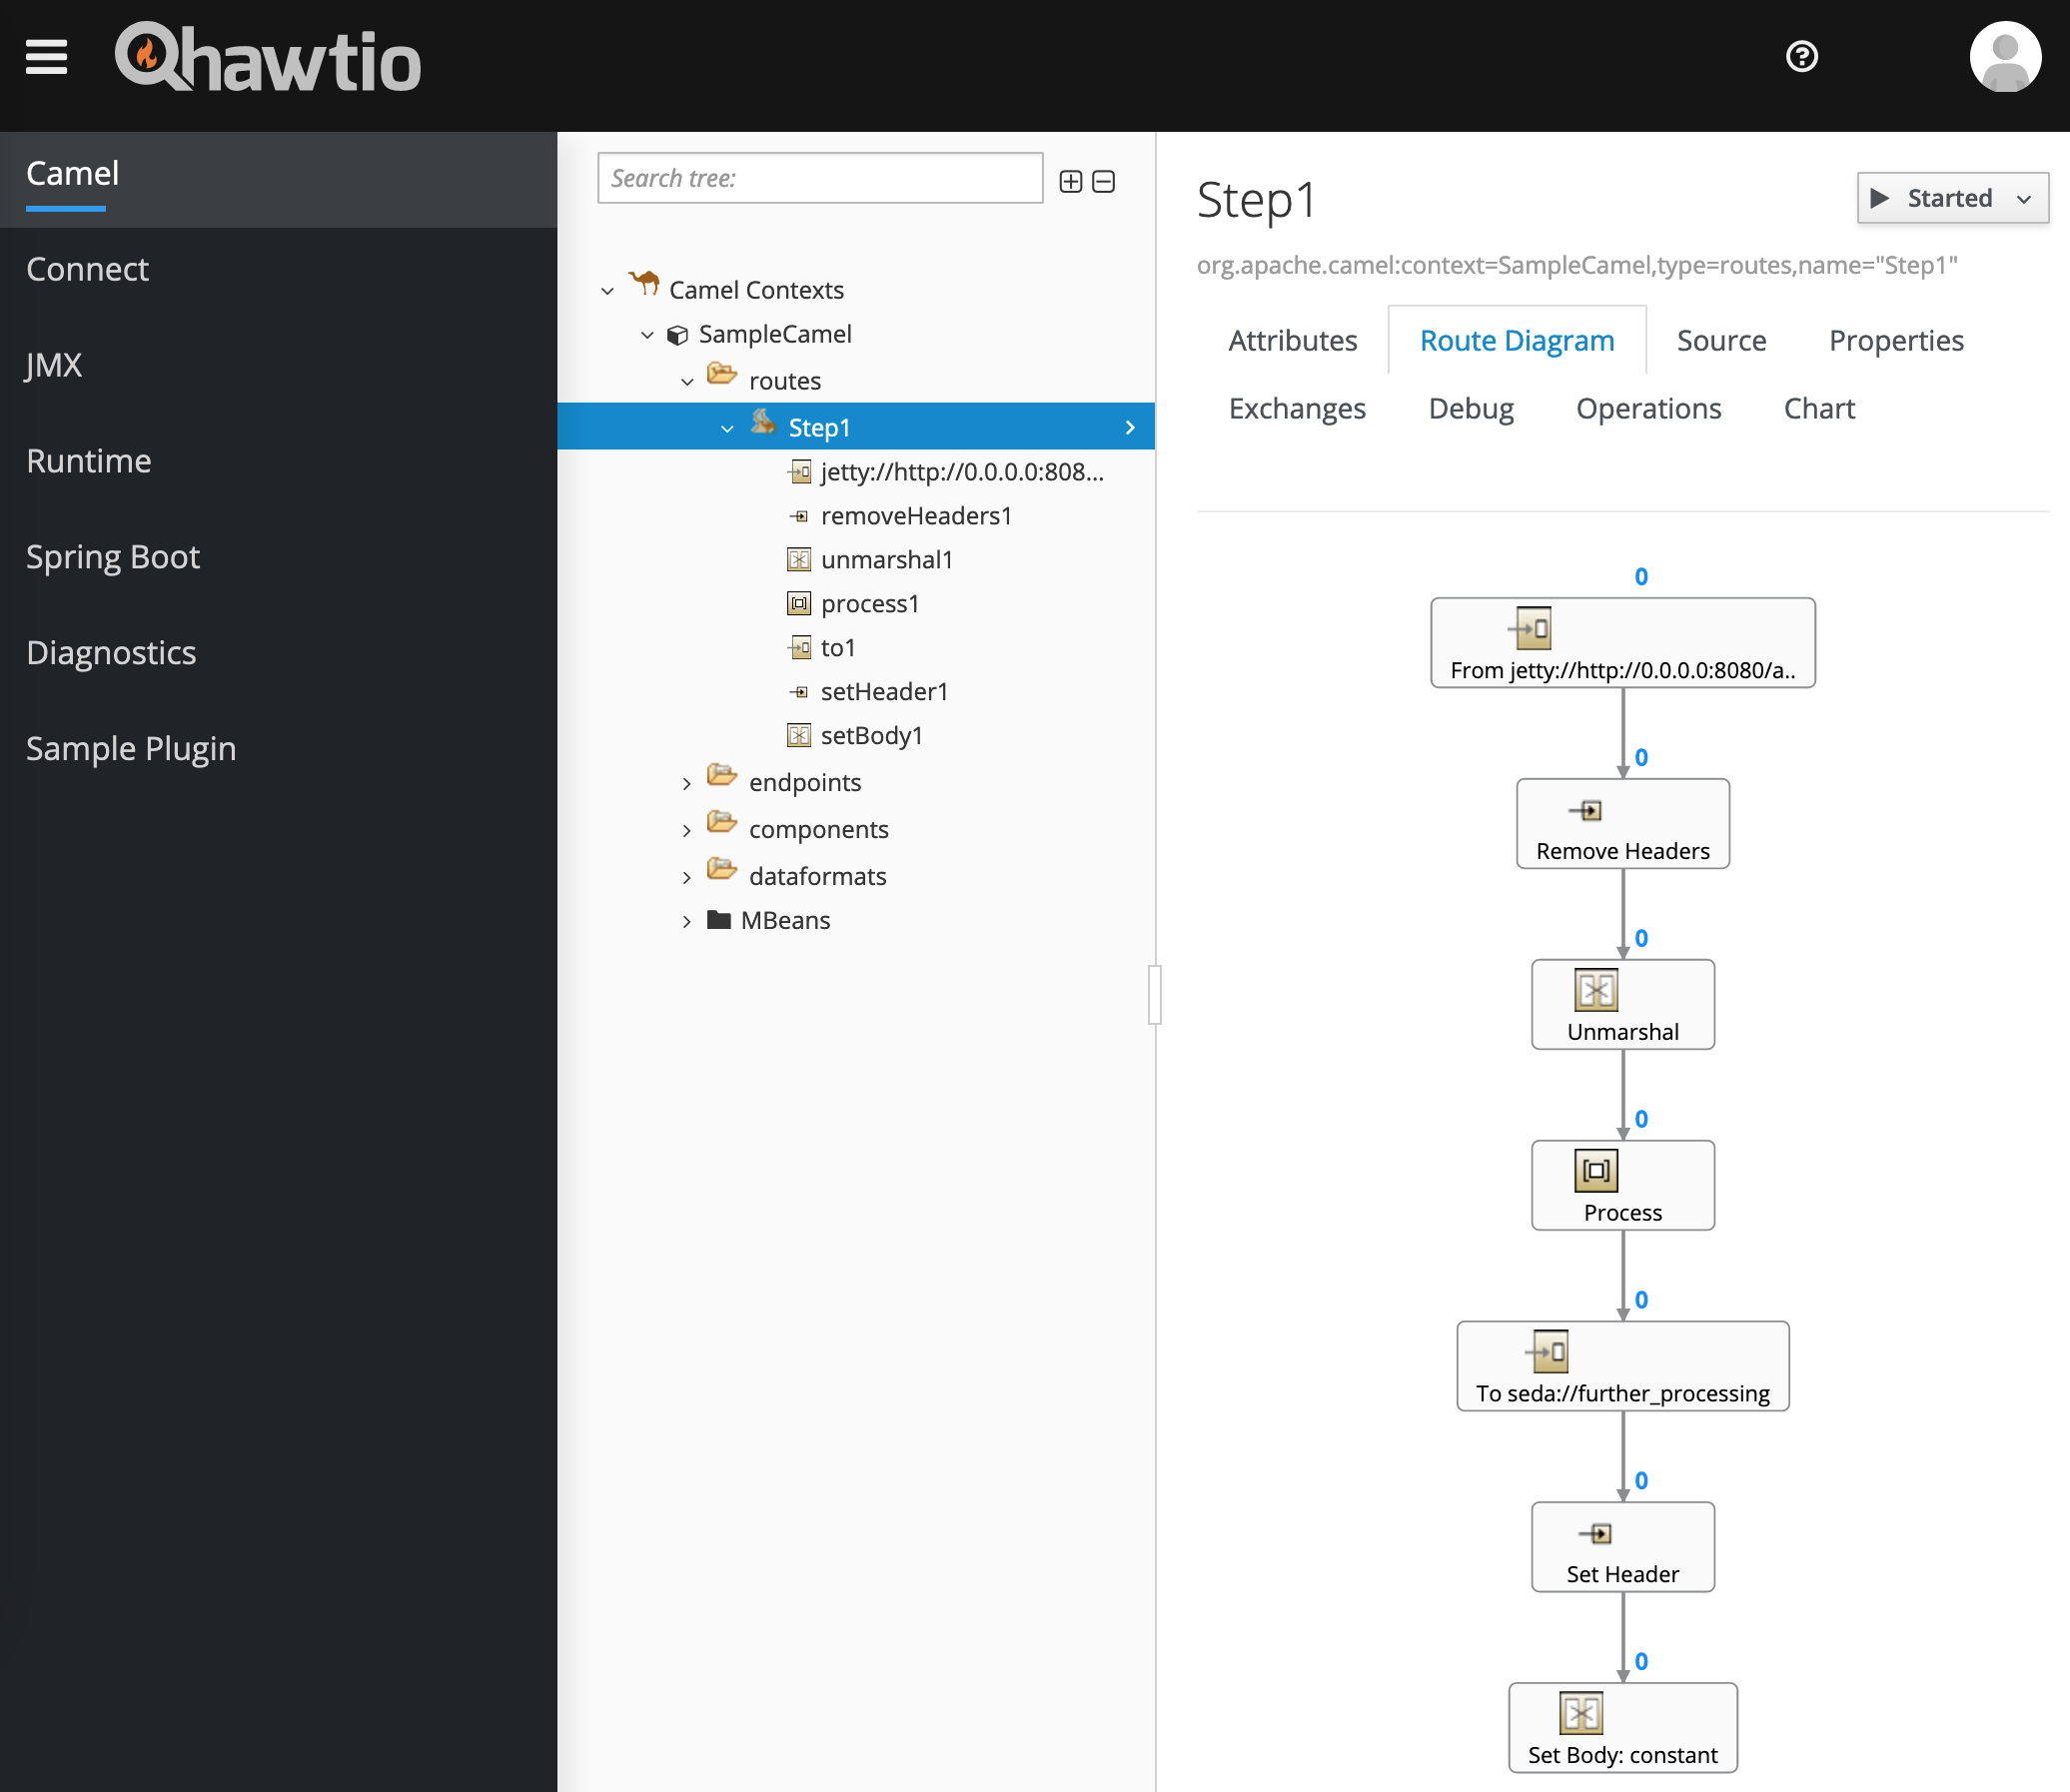
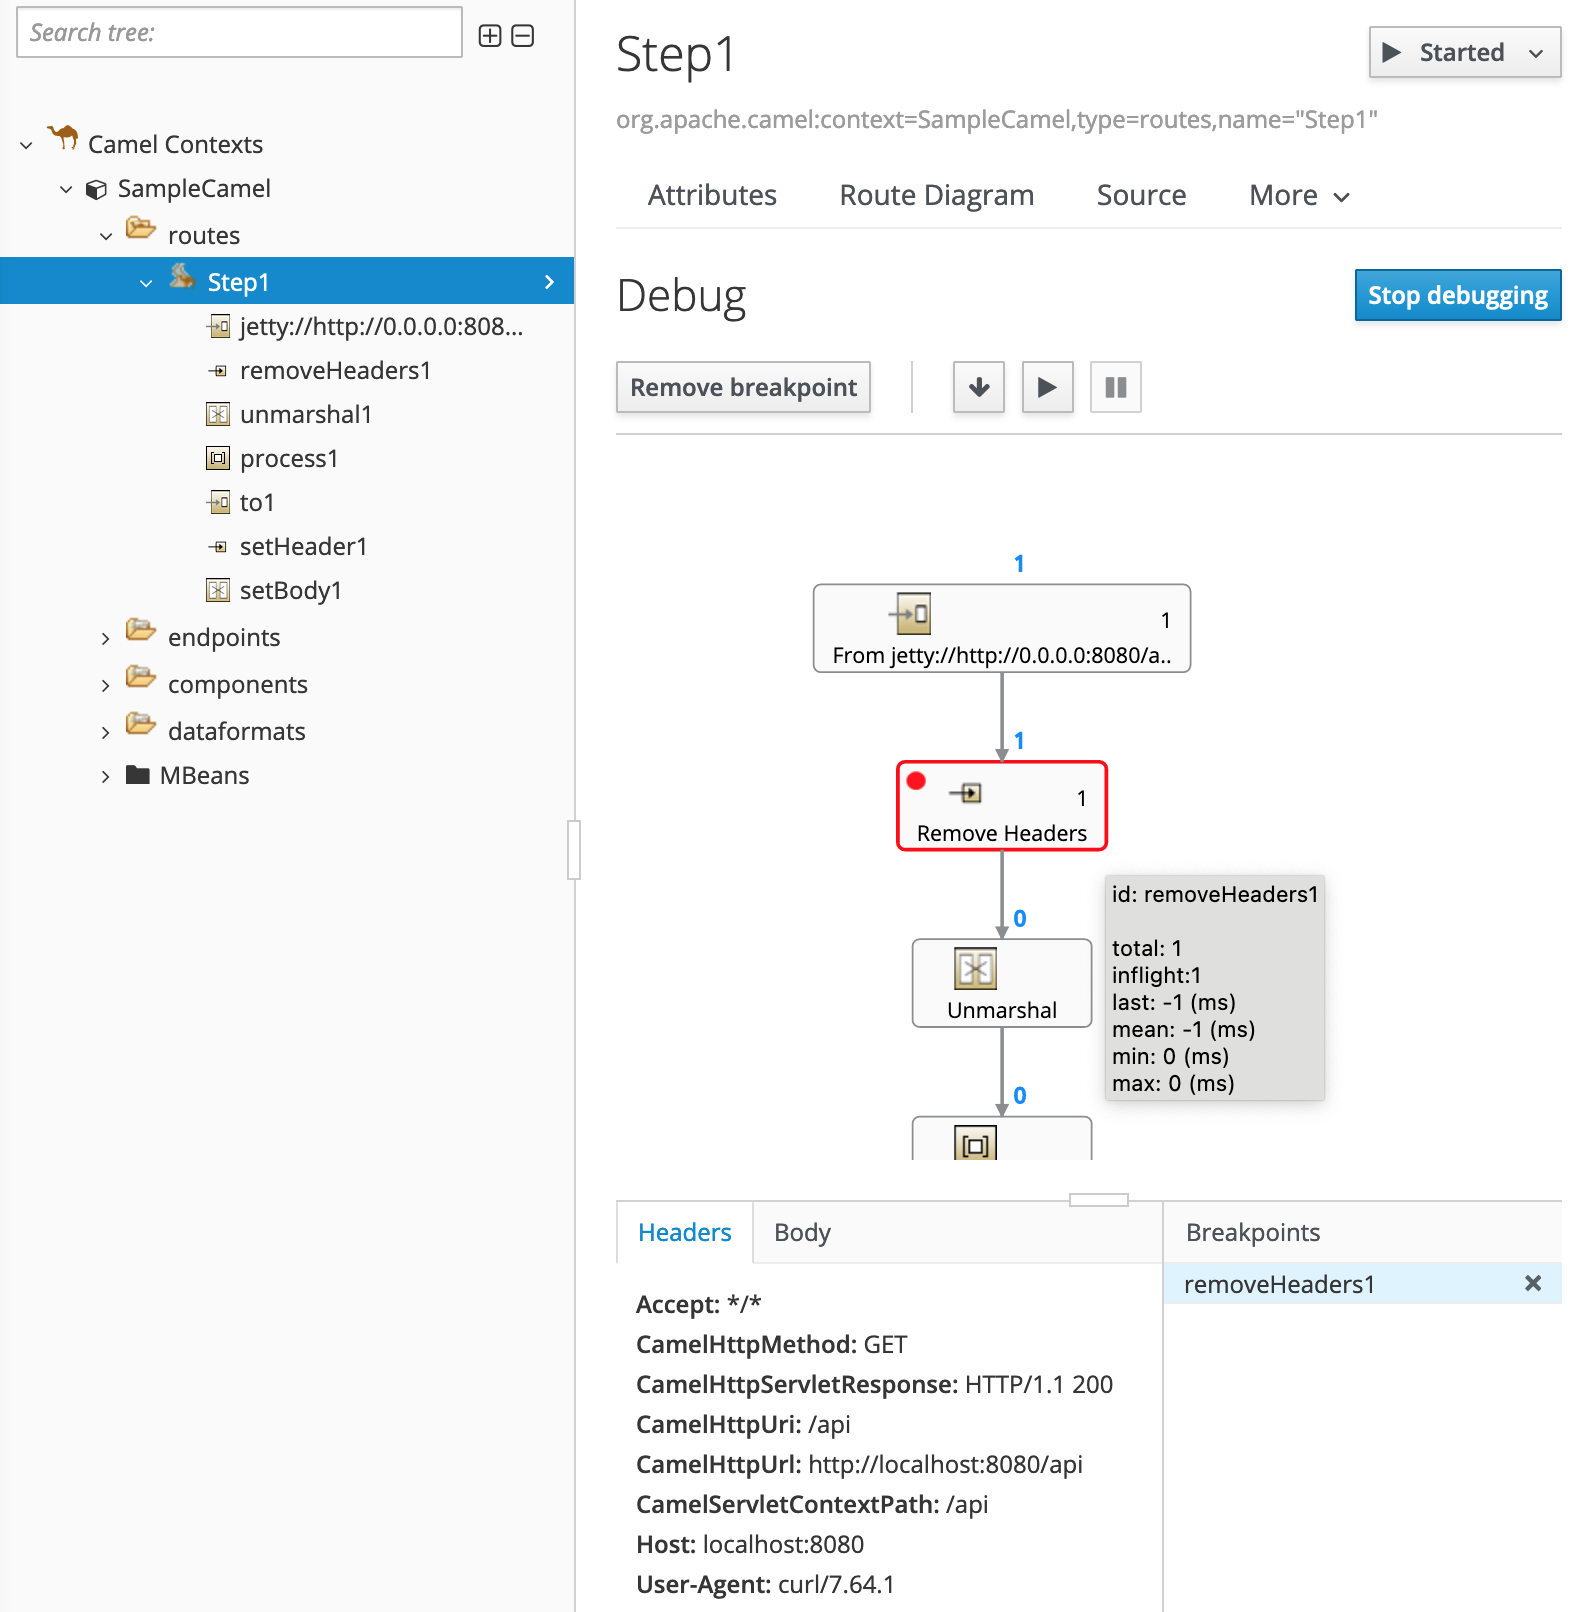
The more powerful tool called Hawtio offers a web-based management interface like the JDK’s binary jconsole. There are several ways to get started. If you embed it to your application and add the following to the RouteBuilder class, you can simply debug the Camel routes of the application in your browser (very useful in cases where the application is running somewhere else):
getContext().setDebugging(true);The web interface shows directly a reached breakpoint and displays the headers and the body of the current message:
Pros
+ nice visualisation of the routes
+ offers many additional features
+ security of interface included
+ possibility to connect remotely
+ write our own or use available plugins to get additional features
Cons
- not as lightweight as other solutions
If you want to try hawtio with Quarkus, maybe take a look at this Github issue.
The Camel Route debugger is an IDE plugin and offers a textual solution to debug Camel routes. It is available for IntelliJ, VS Code, Eclipse Desktop and other IDEs. Starting with Apache Camel version 3.15.0 a breakpoint in the IDE can be set and used for interaction directly in the route (a missing feature in the past).
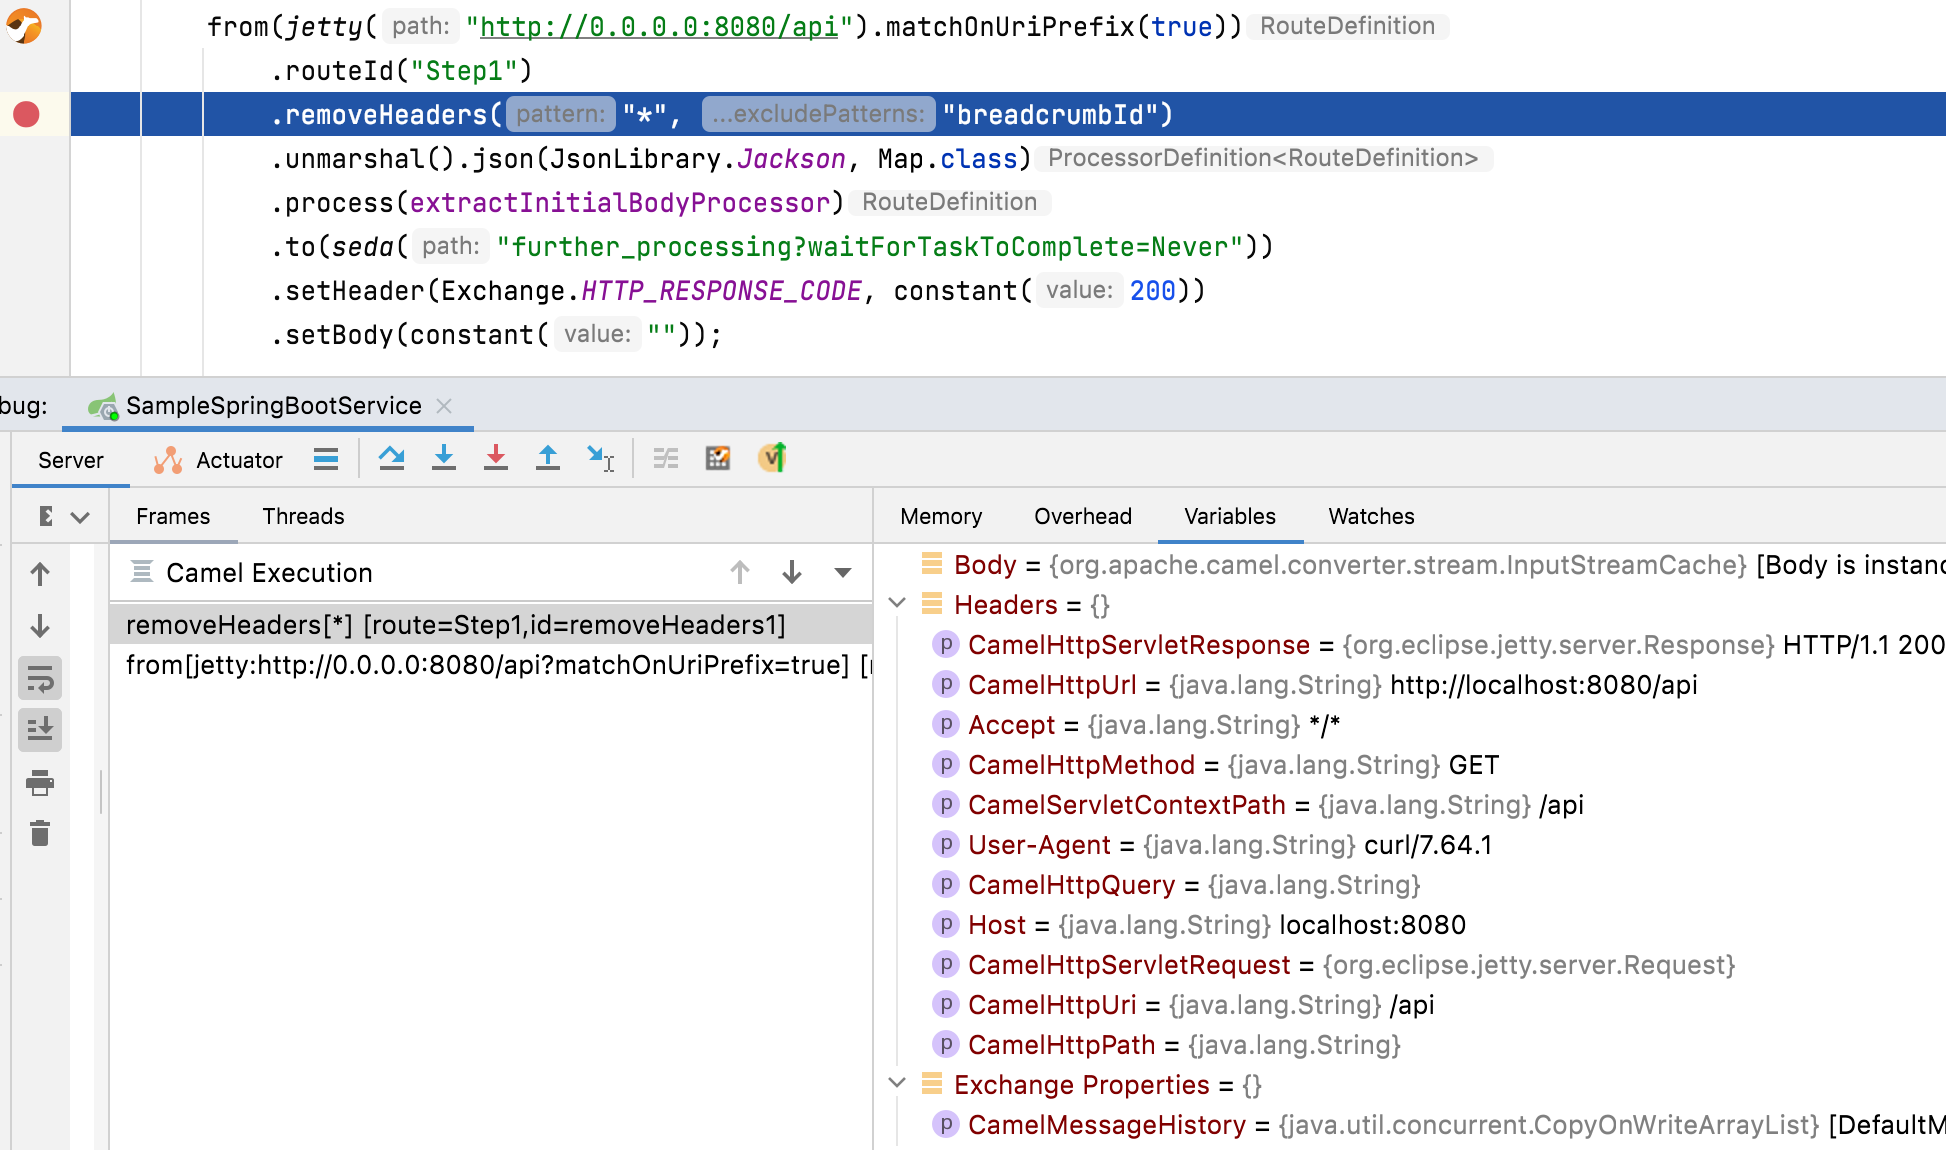
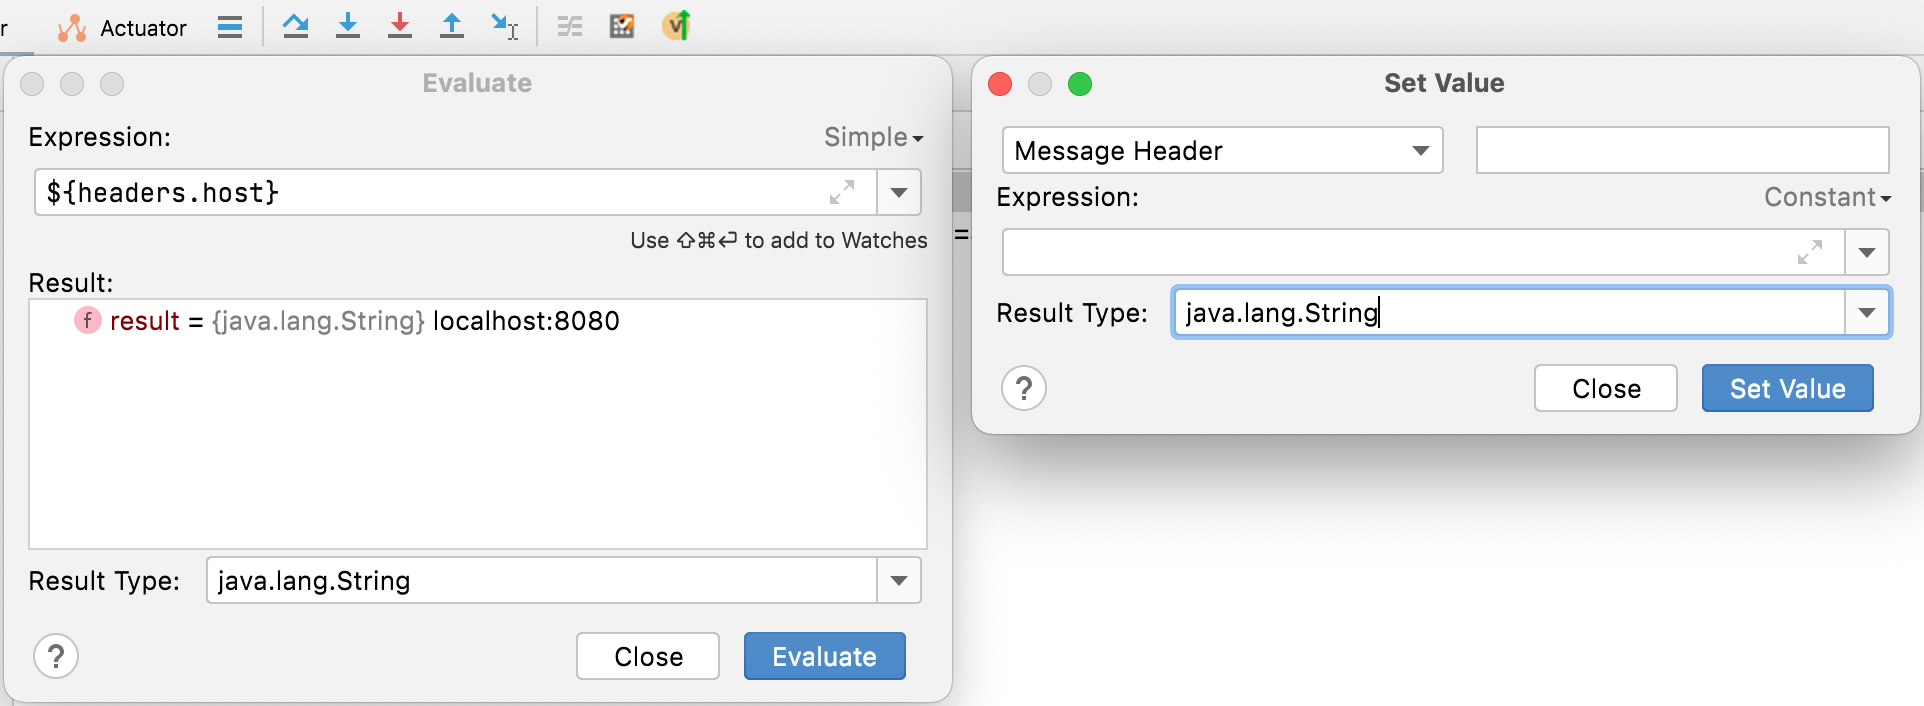
It also allows some evaluations and manipulations:
There are very interesting developments like the recently released IDE plugins and of course experienced tools like Hawtio. Mainly it depends on the requirements what to use. In my point of view, if you would like to
For my purpose the documentation of Camel routes, as described in the beginning, the tool of choice is Hawtio. Especially for automation enthusiasts (as I am) the manual steps can be decreased with the usage of a (GUI) testing tool. The steps to implement would be in general: start the application, connect to the web interface, navigate to the route diagram page and take a screenshot … but that is a topic for another article.
Finally, from my point of view the new debugging features of Apache Camel itself allows newcomers to easily get started with debugging and prevent experienced users from adding inline processors only for debugging purposes.