Thruk is a multibackend monitoring web interface which
currently supports Nagios, Icinga and Shinken using the Livestatus NEB module.
It is designed to be a “drop-in” replacement and targets
covering 100% of the original features plus additional enhancements for large
installations.

How does it work?

thruk architecture
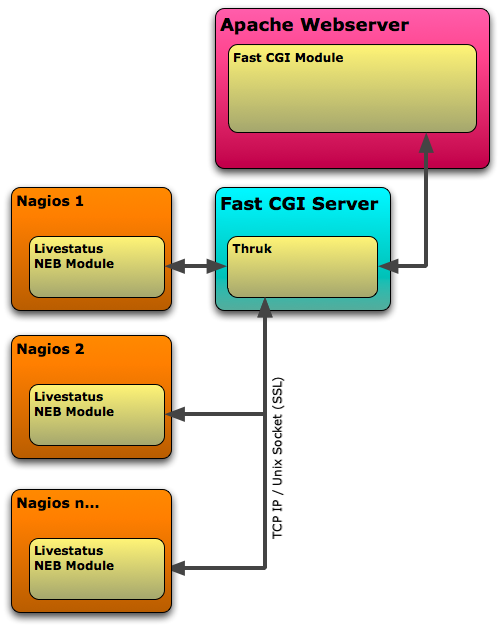
Thruk is written in Perl using the Catalyst Framework. Backend monitoring systems will be connected with the Monitoring::Livestatus Perl Module. Thruk itself is running as a fastcgi process. Authentication is provided by the Apache webserver. You may use mod_auth_ldap or mod_auth_mysql or any authentication module apaches provides.

How does it look like?

extinfo page
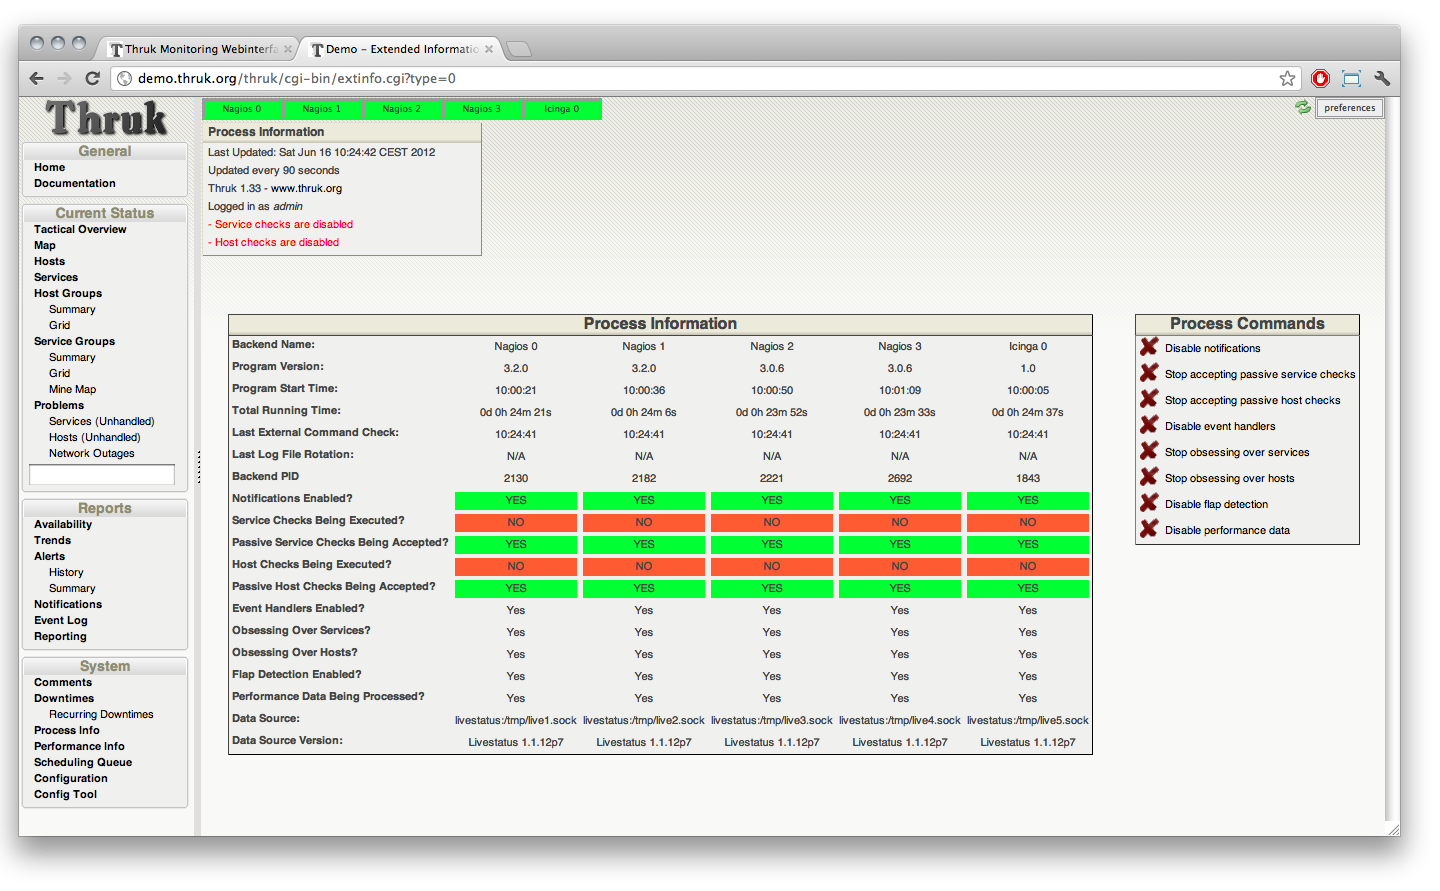
The look and feel is adapted from the classic Nagios cgis but themes can be changed and the usability has been improved.

Main Advantages over the classic gui

  • multiple backends
  • faster, no need to parse status.dat for every request
  • less cpu usage
  • display live data, no delay between core and gui
  • independant from monitoring core, can be installed on remote host
  • clusterable, can be clustered over hosts
  • change status.cgi filter inline
  • extended logfile search
  • better logging, uses log4perl (who submitted which command?)
  • valid HTML code
  • no frames ( can be reenabled for better addon integration)
  • easy to extend with plugins
  • 100% Perl (using Catalyst Framework)
  • paging ( can be disabled and customized )
  • multiple themes included
  • Excel export for status and logfiles
  • Adjustable side menu
  • Full expanded plugin commandline for easy testing
  • Save searches like bookmarks
  • Config Tool included
  • Mobile interface included
  • SLA Reports in PDF format
  • Recurring Downtimes
  • Business Process Addon

Where do i get more information?

You can download Thruk from www.thruk.org. There are also some screenshots, documentation and a
demo installation with 3 Sites.
The source is also available from GitHub and the installation packages are part of the Consol Labs Repository