root@raspberrypi:~# apt-get install omd-1.00
This blog will be continued on blog.consol.de.
Read great stories and news from our colleagues over there.
labs.consol.de will continue to host the OMD repository and static pages. Also
existing blog entries will stay here for archive reasons.
One of our customers is in the process of decommisioning their OpenShift v3.11 cluster. This cluster is currently still used for building customer specific base images. Over time quite a few elaborated pipeline builds (based on Jenkins) have been developed for that purpose.
The customer wanted me to migrate the existing pipeline builds on their v3.11 cluster to Tekton (aka OpenShift Pipeline) builds running on their new v4.9 cluster. This task turned out to be quite pesky. Tekton is a beast in many aspects.
]]>The documentation of software is an everyday business of a software developer and engineer. Especially for integration scenarios a diagram on the flow of a message through the system or the whole landscape is an essential illustration. Fortunately there are standardised messaging patterns which can be used. Unfortunately, however, there is no tool which can create such visualizations out of the box directly of source code. In this article we will have a look at Apache Camel and how it is possible to get a graphical representation of an integration route. We will also discuss about debugging it, as some tools have the feature to do this.
]]>Today software often needs to be run in cloud environments. Newly developed software, especially microservices are developed with cloud readiness in mind.
But we not only have microservices in business environments, we also have integration software. This type of software is developed and designed to connect external services to internal ones.
This article is the author’s opinion on similarities and differences between Streaming and Messaging.
The first time I was busy with the terms messaging and streaming was during my master thesis in 2016. Among other things, the thesis was about different strategies of microservices integration. During that time, the term messaging was popular. Moroever, Kafka, which is a streaming platform, was popular, too. From a high-level perspective, messaging, kafka and streaming seem to be the same thing… but I never understood, why we have these two terms which are used synonymously in many contexts: messaging and streaming. This article is my answer to that question.
]]>Some time ago, I started a project to create a Helm based operator for an OpenShift application. I used the Operator SDK to create the Helm operator. The Operator SDK documentation describes the parameters pretty good, and it contains a simple tutorial. it does not, however, describe the complete development cycle. This article aims to describe everything from creating the operator to the point where you can upload your operator to OperatorHub.io. We start with a basic Helm Chart. With this, you can install Nginx as a StatefulSet. You can find the source code in my github repo. Before we can start with creating an operator, we need to fulfill some prerequisites.
]]>The first version of RabbitMQ has been released in 2007. Back in these days, the goal was to provide a complete open source implementation of Advanced Message Queuing Protocol (AMQP), aiming at modern messaging needs such as high availability, high performance, scalability and security.
Nowadays, RabbitMQ is one of the most popular message brokers and can be found in several domains.
This article lights up core concepts and compares it with ActiveMQ Artemis and AWS SQS.
Last summer I watched the Red Hat master course about Kafka from Sébastien Blanc. The Kafka setup in Kubernetes presented in the course looked pretty easy. The Kafka client implementation for Java seemed to be easy as well. Furthermore, I wanted to use Kafka for a long time, so I got the idea to extend my Istio example. Each time a service is called, a message is sent to a topic. The service (implemented in Quarkus), as well as the Kafka cluster should be in an Istio Service Mesh and secured with mTLS. I found descriptions of Joel Takvorian that Kafka works with Istio, so I knew (or at least hoped) that my plan should work.
This article will describe the overall architecture of the example and which obstacles I encountered during deployment.
]]>AWS Comprehend is a great tool when you want to extract information from textual data. As a managed service it is really easy to setup and can be used with next to no prior knowledge of machine learning. But there is one minor thing that bugs me about Comprehend: The Output.
TL;TR output.tar.gz bad, flat json file good.
See python code below for transformation.
Automatic integration tests as part of the development life cycle can save a lot of time and money. Not only when dealing with other service APIs or offering some, also if the application uses a database or other infrastructure services.
We at Consol made a lot of good experience to develop the integration tests as part of the life cycle from the beginning of a project. Therefor the Citrus framework is often a good choice to do it automated.
But there are other frameworks and libraries which can be useful. In this article, we’ll have a look at Testcontainers. By using a sample microservice, we will show how Testcontainers can be used and what chances it provides.
]]>So you have this nifty web application deployed on your OpenShift cluster and you want to make it accessible by the whole world with HTTPS under the name coolapp.<mydomain>
. Unfortunately you face several issues:
Exposing the service to your web application leaves you with a route using the self-signed certificate that was generated during setup of the cluster. None of the browsers in the wild will trust this certificate.
The self-signed certificate dictates URLS of the form https://<appname>.apps.<clustername>.<mydomain>
(or whatever domain suffix you configured). Not very nice.
You might mitigate the previous issues by getting an official certificate signed by a generally trusted institution. But you will have to pay for it.
And you will have to pay for it not only once but every year (latest every 389 days) thanks to recently tightened certificate policies installed by all major browser vendors.
Worst of it all: You must not (by any means) forget to apply for a new certificate in a timely manner and replace the certificate in your route before the old expires. Otherwise some people might get pretty angry about you.
Let’s Encrypt to the rescue!
]]>During a discussion with a customer, we talked about which steps are necessary to add an application to a services mesh. Which should be no big deal. Unfortunately, there is not a simple guideline how to do that for the Red Hat OpenShift Service Mesh. Furthermore, I was not sure how the requests for the application would look like in Jaeger. To clarify these points, I created a small application. Which I then deployed on OpenShift and added it to a service mesh control plane. This is the documentation of the steps that I have done.
]]>During this year’s Red Hat Summit I had the chance to get a glimpse of the latest version of Kiali. This version had some nice features, like the traffic flow of the application graph during a time period (Graph replay). It also contains wizards to create destination rules and virtual services. This demo has struck my curiosity to get the hands on this Kiali version. One obstacle for me was that my Kiali is running in Red Hat OpenShift Service Mesh and is controlled by the Kiali operator. Currently, it is using version 1.12. The version that I wanted to try was the latest release version (1.17). The Red Hat OpenShift Service Mesh does not support this version. This article describes what we need to do in order to replace the Kiali version of an Red Hat OpenShift Service Mesh with the latest version of Kiali.
]]>Some time ago, I did a webinar about the RedHat Service Mesh, which is based on Istio. For this webinar, I prepared a demo application. Among other things, I wanted to show how to do the authentication with JWT token in general and, more specific, with Keycloak. This article will describe how to configure Keycloak. In the second article, I will show you what problems I encountered running the application in Istio and how I figured out what was wrong in my configuration. You can find the article here
]]>In the article, I’m going to describe what we can do, if we configured our application to use Istio, but it is not working like intended. Originally, I wanted to give a detailed description what problems I encountered during the creation of my webinar and how I fixed them. However, I came to a point where this would be a very long one. I hope that you don’t mind that I shortened it and just describe which tools are available to debug
the Istio configuration. In my previous article I described how to configure Keycloak for my webinar. So without further ado, let’s start.
In this article, I will show you how to install Red Hat OpenShift Container Platform 4.3 (OCP) on VMware vSphere with static IPs addresses using the openshift installer in UPI mode and terraform. In contrast to the official OpenShift 4.3 install documentation, we will not use DHCP for the nodes and will not setup the nodes manually - instead we will use static IP addresses and terraform to setup the virtual machines in our vCenter.
]]>So here is another one of our series Installing Blahblahblah on OpenShift. This time it is about getting MongoDB to run on OpenShift - the way recommended and promoted by the MongoDB guys. The whole setup is still in beta stage as indicated on these two entries in Red Hat’s container image catalog. You can get your MongoDB instance up and running on OpenShift. But most of the required steps have to be performed on the command line, contrary to the impression given by MongoDB, Inc that once you get the MongoDB Operations Manager up and running everything can be achieved via this tool’s GUI. Some operations in the Operations Manager simply do not work (yet) on OpenShift.
]]>With the release of OpenShift 4.x Red Hat left no stone unturned (compared to previous 3.x versions). Among many things Minishift became Red Hat CodeReady Containers. Having been a big fan of Minishift I recently wanted to give CodeReady Containers (aka CRC) a try.
Turned out this is not that easy - at least if you want to run CRC on a Linux that does not come from Red Hat (or its community). This article gives instructions for all those people out there who want to run CodeReady Containers on Ubuntu.
Update 2020-12-17: According to this comment on GitHub by one of the maintainers / developers of Red Hat CodeReady Containers the issues with Ubuntu have been resolved in the latest version of CRC.
]]>AWS Cloud Development Kit (CDK) is a relatively new kid on the block. It is a tool for defining Infrastructure as Code (IaC) and is considered to be the future successor of AWS CloudFormation.
This article overviews the IaC approach, introduces a reader to the AWS CDK, shows what problems it aims to solve and presents a simple example application implemented with it.
]]>GraphQL is a nice way to publish a highly customizable API. In combination with Spring Boot, which makes development really easy and offers features like database integration and security, you can quickly build your API service from scratch.
This is the second part of the series in which we will create a REST-Service based on Spring Boot which will be translated in a GraphQL Service in the 3rd part of this little series.
]]>We recently had to install a bunch of applications on a customer’s shiny new OpenShift 3.11 cluster. Among others also GitLab. Turned out getting GitLab up and running on OpenShift is not so easy. What I found on the Internet about installing GitLab on OpenShift was partly outdated and not 100% accurate. Most information was about getting GitLab into a Kubernetes cluster. So I had to adapt these information to the situation in an OpenShift cluster.
This article is the conclusion of all these findings and efforts and gives a step-by-step recipe on how to install GitLab on OpenShift.
]]>One of the most challenging questions in cloud environments is about how secure is my application when its deployed in the public cloud ?
Its no secret that security aspects are much more important in a public cloud than it was in classic environments.
But dont be surprised that many applications even in public cloud dont follow best practice security patterns.
This has several reasons for example time and costs are very high trying to achieve a high security level.
But in fact AWS and Kubernetes offer many options which let you improve your security level without too much effort.
I like to share some of the possibilities that you have when creating a secure AWS EKS cluster.
GraphQL is a nice way to publish a highly customizable API. In combination with Spring Boot, which makes development really easy and offers features like database integration and security, you can quickly build your API service from scratch.
This is the start of a series from articles showing you the way to a Spring Boot powered REST-Service with an API running Spring Boot and Graphql.
Under the name of “Managed Kubernetes for AWS”, or short EKS, Amazon offers its own dedicated solution for running Kubernetes upons its cloud platform. The way this is provided is quite interesting: While the Kubernetes Master Infrastructure is offered “as a service” (and also billed separately) the Kubernetes Worker Nodes are simply EC2 instances for which Amazon provides a special setup procedure. These now also offer the potential to use well known AWS features like Autoscaling for Kubernetes workloads.
However, manually setting up this infrastructure is still quite a complex process with multiple steps. To be able to quickly have an EKS Kubernetes Cluster up and running, and also to deploy a software project on it, we created a small helper project that offers the creation of a “turnkey ready” EKS cluster that can be quickly pulled up and also teared down after usage.
]]>AWS offers a great service called “Amazon Elastic Container Service for Kubernetes” (AWS EKS).
The setup guide can be found here: Offical AWS EKS getting started guide
If you overload such a cluster it easily happens that your Kubelet gets “Out of Memory” (OOM) errors and stops working.
Once the Kubelet is down you can see kubectl get nodes
that node is in state “NotReady”.
In addition if you describe your node kubectl describe $NODE
you can see the status description is: “System OOM encountered”.
If you look on your pods kubectl get pods --all-namespaces
you can see that pods are in state “Unknown” or in “NodeLost”.
Kubelet OOM errors should be avoided by all costs.
It causes to stop all pods on that node and its quite complicated for K8s to maintain high availability for applications in some cases.
For example for stateful sets with a single replica k8s cannot immediately move that pod to another node.
The reason is that k8s does not know how long the node with all its pods stays unavailable.
Therefore i like to share some best practice to avoid OOM problems in your AWS EKS clusters.
]]>In the first article of this series, Getting started with AWS Lambda, we used a Cloudformation template to provision and deploy all needed parts for our REST application.
In this and the following articles, we are going to explore components used in the template. The focus of this article is the network infrastructure components.
]]>Recently, I stumbled on a situation where I wanted to add a couple of values to an OpenShift deployment configuration. Previously I had modified or added a single attribute in a yaml file with oc patch
. So I started to wonder whether it is possible to update multiple attributes with oc patch
as well. To get right to the result: Yes, it is possible. This article will show you which features oc patch
and likewise kubectl patch
really have, beside a simple modification of one attribute.
After some time, let’s move on to another topic around making OpenShift environments more developer friendly. This time we are going to look at what happens, when a system test actually failed, and how to enable developers to properly react.
]]>Kubernetes and OpenShift have a lot in common. Actually OpenShift is more or less Kubernetes with some additions. But what exactly is the difference?
It’s not so easy to tell as both products are moving targets. The delta changes with every release - be it of Kubernetes or OpenShift. I tried to find out and stumbled across a few blog posts here and there. But they all where based on not so recent versions - thus not really up-to-date.
So I took the effort to compare the most recent versions of Kubernetes and OpenShift. At the time of writing v1.13 of Kubernetes and v3.11 of OpenShift. I plan to update this article as new versions become available.
]]>The license change to Java SE 8, as well as the new license for Java SE 9 and onwards lead to confusion within the Java community. Looking for information on the web, one finds results in the spectrum from “Is Java in Jepoardy?” to “Java is still free!”. The good news is: yes, Java is still free. The bad news: not necessarily Oracle’s Java distribution.
In this article, we discuss the situation revolving around Oracle’s license change and its consequences. For this, we need to understand how the Oracle JDK is connected to OpenJDK. Furthermore, we take a look at some alternatives to Oracle’s Java distribution and how divergence between the different distribution is avoided.
What you will need:
Lambda is AWS’ realization of a serverless architecture. Instead of deploying instances and scaling them manually, developers deploy only their code and AWS executes the code. Different triggers for code executions can be defined, e.g. when a new event in an AWS Kinesis stream is published or when a REST endpoint is accessed.
Since AWS takes care of Lambda execution, the Lambda does automatically scale in and out to current needs. Coupled with its “pay only for what you use” pricing and the fact that lambda execution can scale to zero when no lambda is executed, AWS Lambda is an interesting technology.
]]>The OpenShift command line interface is a very powerful tool which is quite useful for beginners and advanced user of OpenShift alike. Some of its features are not well documented or not documented at all. In this article I would like to shed some light on commands that I personally find useful and that are, from my observation, not widely in use. So without further ado, let’s start with the commands:
]]>Our world is full of various processes: tracking of goods delivery, currencies trading, monitoring of server resources, hotel bookings, selling goods or services etc. Since these processes occur over time, they can be described by time series data.
Successful businesses always take advantage of their data by analyzing it and then making predictions (e.g. predicting volume of sales for the next month) and business decisions (e.g. if the volume of sales grows then additional goods need to delivered to a warehouse).
There are a number of technologies for analysing the time series data. This article gives an introduction to one of them which is called TimescaleDB which is an open source solution for time series data analysis based on battle-tested PostgreSQL DBMS.
]]>OMD Labs Edition 2.80 has been released today. The OMD Labs Edition is based on the standard OMD but adds some more useful addons like Grafana and Prometheus or additional cores like Icinga 2 and Naemon. This release updates many of the shiped components and adds some more usefull features.
]]>The Prometheus monitoring tool follows a white-box monitoring approach: Applications actively provide metrics about their internal state, and the Prometheus server pulls these metrics from the applications using HTTP.
If you can modify the application’s source code, it is straightforward to instrument an application with Prometheus metrics: Add the Prometheus client library as a dependency, call that library to maintain the metrics, and use the library to expose the metrics via HTTP.
However, DevOps teams do not always have the option to modify the source code of the applications they are running.
At this year’s JavaZone conference, Fabian Stäber did a talk on how to instrument Java Web Applications with Prometheus metrics without modifying the application’s source code.
]]>As the number of microservice based architectures continues to grow, development teams are facing new challenges when choosing the adequate tools for the job. At the technical level, the decisions need to be made considering the features of both: the cloud or container platform that is going to be used for the deployment and the runtime that will be used by the software. The infrastructure needs to be aware of the health and metrics of the software and the software itself must make the most of the infrastructure by tolerating failures and being able to handle configuration changes. There are numerous solutions for the individual challenges but the lack of an enterprise level blueprint actually paved the way for Eclipse Microprofile.
]]>Let’s move on with this little series about how OpenShift environments may fall short in terms of developer experience.
Today we focus on the role that system tests have in an OpenShift infrastructure and what might possibly go wrong here testdata-wise.
]]>The new release also brings a bunch of enhancements and bug-fixes, a detailed changelog is included in this post.
Once again, we want to say THANK YOU for the great support of our contributors, our valued supporting companies and of course ConSol!
]]>In some OpenShift environments for building and delivering software we notice that the needs of developers, arguably a group of people who will have a great deal of contact with the platform, are not met as thoroughly as would have been possible.
Especially when it comes to software testing there is often much room for improvement. The usage of container platforms can improve testing techniques a lot but might also be a major blocker when it comes to the provided infrastructure. Good testing is already hard. Everything that makes it even harder, by forcing your developers into workarounds or compromises on testing quality will result in larger round trips, more testing effort, less valid testing, in short: wasted time.
So in this mini series of blog posts we will have a look into some possible fields of improvement and give recommendations on how to fix the respective situation.
Today we evaluate the fact, that some CI/CD setups for OpenShift may spoil the most simple type of testing a developer uses: Just running the software locally - in OpenShift.
]]>This report is about the experience, I’ve made with Arch Linux as the operating system for a developers workstation. You’ll be introduced into the concepts of Arch Linux, followed by a introduction into the main tasks such as package installation and OS maintenance. At the end, I’ll discuss why I think that Arch Linux is a great OS for developers, and finish with a conclusion.
]]>Prometheus is a popular monitoring tool based on time series data. One of the strengths of Prometheus is its deep integration with Kubernetes. Kubernetes components provide Prometheus metrics out of the box, and Prometheus’s service discovery integrates well with dynamic deployments in Kubernetes.
There are multiple ways how to set up Prometheus in a Kubernetes cluster. There’s an official Prometheus Docker image, so you could use that and create the Kubernetes YAML files from scratch (which according to Joe Beda is not totally crazy). There is also a helm chart. And there is the Prometheus Operator, which is built on top of the CoreOS operator framework.
This blog post shows how to get the Prometheus Operator up and running in a Kubernetes cluster set up with kubeadm. We use Ansible to automate the deployment.
]]>Kubeadm is a basic toolkit that helps you bootstrap a simple Kubernetes cluster. It is intended as a basis for higher-level deployment tools, like Ansible playbooks. A typical Kubernetes cluster set-up with kubeadm
consists of a single Kubernetes master, which is the machine coordinating the cluster, and multiple Kubernetes nodes, which are the machines running the actual workload.
Dealing with node failure is simple: When a node fails, the master will detect the failure and re-schedule the workload to other nodes. To get back to the desired number of nodes, you can simply create a new node and add it to the cluster. In order to add a new node to an existing cluster, you first create a token on the master with kubeadm token create
, then you use that token on the new node to join the cluster with kubeadm join
.
Dealing with master failure is more complicated. Good news is: Master failure is not as bad as it sounds. The cluster and all workloads will continue running with exactly the same configuration as before the failure. Applications running in the Kubernetes cluster will still be usable. However, it will not be possible to create new deployments or to recover from node failures without the master.
This post shows how to backup and restore a Kubernetes master in a kubeadm
cluster.
This blog post shows how to use CIFS (a.k.a. SMB, Samba, Windows Share) network filesystems as Kubernetes volumes.
Docker containers running in Kubernetes have an ephemeral file system: Once a container is terminated, all files are gone. In order to store persistent data in Kubernetes, you need to mount a Persistent Volume into your container. Kubernetes has built-in support for network filesystems found in the most common cloud providers, like Amazon’s EBS, Microsoft’s Azure disk, etc. However, some cloud hosting services, like the Hetzner cloud, provide network storage using the CIFS (SMB, Samba, Windows Share) protocol, which is not natively supported in Kubernetes.
Fortunately, Kubernetes provides Flexvolume, which is a plugin mechanism enabling users to write their own drivers. There are a few flexvolume drivers for CIFS out there, but for different reasons none of them seemed to work for me. So I wrote my own, which can be found on github.com/fstab/cifs.
This blog post shows how to use the fstab/cifs
plugin for mounting CIFS volumes in Kubernetes.
ConSol CM brings BPM to a CRM system. In-house ConSol CM is used to process cases of a wide range of types. Amongst others it also maps the sales process. For that purpose a new sales case is created automatically or manually every time a sales opportunity or lead comes up. To these cases, information can be added concerning the communication with the customer, the origin of the opportunities and others.
Within a research and development project the scope was to predict the success for open sales cases, using machine learning algorithms. This way, sales employees would know already in an early stage if the opportunity most probably will be successful or how to adapt their strategy during the sales process to increase the chances for success.
]]>Docker Headless VNC Container 1.3.0 has been released today. The different Docker images contains a complete VNC based, headless UI environment for testautomation like Sakuli does or simply for web browsing and temporary work in a throw-away UI container. The functionality is pretty near to a VM based image, but can be started in seconds instead of minutes. Each Docker image has therefore installed the following components:
]]>In this article I will show you how to use Apache FreeMarker to implement dynamic and complex configurations in Java projects that can be configured from outside the application.
]]>Database communication is an essential part of many applications, when persistent data storage is required. May it be orders, customer data, product recommendations or product information, if persistent storage is in place, the data contains a certain business value. Therefore it’s important that your software handles your persistent storage the right way.
In this blog post you’ll learn how to test your database communication using Citrus.
]]>At this year’s FOSDEM conference I did a 30 minutes presentation on Monitoring Legacy Java Applications with Prometheus. The talk gives an overview of some of the options you have for monitoring Java applications with Prometheus when you cannot modify the application’s source code:
The video is available below.
]]>In diesem Blogartikel wird gezeigt, wie das Monitoring-Plugin check_nwc_health auf eigene Bedürfnisse angepasst bzw. erweitert werden kann.
Ursprünglich sollte nur die Logik des Modes ha-role
modifiziert werden, um den Status von Cluster-Nodes nur zu reporten, anstatt zu alarmieren. Heraus kam eine Statusanzeige im Thruk-Frontend auf Basis von Host-Macros…
There are a lot of articles that show how to monitor an OpenShift cluster (including the monitoring of Nodes and the underlying hardware) with Prometheus running in the same OpenShift cluster. This article however is based on a different scenario: You are responsible for an application on an OpenShift cluster and want to monitor just this application, but you don’t have any administrative permission on it. The reason for this can be that you are working in a big company where the operation of the OpenShift environment is outsourced or the process to introduce a new monitoring solution takes way too long or the current monitoring solution doesn’t match your requirements and so on.
In this article I’m going to show you how to setup the monitoring of a demo application in 6 easy steps. The example is built in that manner that it will be easy for you to do the same for your application. A side note: If the OpenShift cluster that you are using will be monitored in the future with a different Prometheus setup, you don’t need to start from scratch. You might need to tweak the configuration of your scraping a bit and you need to move your dashboard to a different Grafana but that should be it.
]]>Imagine your’re working on a bigger feature in a complex piece of software. Your implementation is complete, all tests in scope turned green and you push your changes for integration testing. Then, some integration tests from a completely different module fail and you have no clue which change may have caused this. Now you start analyzing the issue. Probing your commits by hand would end up in a very tedious process for sure. Thankfully git can do all the work for you, while you enjoy a cup of coffee.
The high-level command git bisect
allows you to automatically run a specified test procedure, while it’s crawling through your commit history to find the bad revision.
Also we wan’t to say a big THANK YOU for the great support of our contributors, our valued supporting companies and at least ConSol for making this possible as open source software. Double Thumbs up!!!
]]>The Tutorial “Docker based E2E application monitoring with Xfce UI and OMD Labs” describes how to:
Sources: see github.com/ConSol/sakuli-examples
]]>The Prometheus monitoring tool follows a white-box monitoring approach: Applications actively provide metrics about their internal state to the Prometheus server. In order to instrument an application with Prometheus metrics, you have to add a metrics library and call that library in the application’s source code. However, DevOps teams do not always have the option to modify the source code of the applications they are running.
At this year’s Devoxx conference, Fabian Stäber did a talk on how to instrument Java Web Applications with Prometheus metrics without modifying the application’s source code.
]]>For unit testing purpose you can use mocks that help out to simulate proper responses. There will be times where your software is deployed to a test environment
in order to perform some acceptance tests with your stakeholders before going to a final release. Usually this is also done with the customer exploring the software through manual testing. In these situations traditional service mocking is not
a good option and you need a real simulator instance that receives requests and responds with proper test data.
This is exactly what the Citrus simulator project provides for you. Standalone simulation and complex request/response processing with solid validation capabilities. The Citrus simulator provides a very easy and reliable definition of inbound and outbound messages for different scenarios.
Good news is that this is not only for Http REST interfaces but also for SOAP WebService, JMS, RMI, mail messaging and many more. So you can use the simulator whenever you need to integrate with another service that is simply not available on your local machine or in your test environment.
Docker Headless VNC Container 1.2.0 has been released today. The different Docker images contains a complete VNC based, headless UI environment for testautomation like Sakuli does or simply for web browsing and temporary work in a throw-away UI container. The functionality is pretty near to a VM based image, but can be started in seconds instead of minutes. Each Docker image has therefore installed the following components:
]]>Which programming language should we use to write monitoring check_plugins? This question rose some discussion and this post is trying to give some hints.
]]>I recently had to deal with two projects that have a common origin but separated at some point in time. I now had to try to bring them back together again - basically merging the changes. Sounds like a pretty standard git merge
or git rebase
job.
Unfortunately the separation was done in a not so clever way. Someone cloned the original repository, checked out some branch, made some first refactoring steps, got rid of the git stuff (probably rm -rf .git
) and started a new git repository with this status. Rumors are that the situation at that time was so tense that people wanted to make a clear cut - which they did in a technical way.
Quite some time later it was my task to try to get the projects together again. The only input I had was two git URLs and the above story.
]]>Have you ever written a NEB (Nagios Event Broker) module? This article will explain a tool which makes this a lot easier, especially if the reason was that you are not familiar with C or C++. In this case the “Go NEB Wrapper” could come very handy and if you are new to this topic it is a good point to start with.
]]>OMD Labs Edition 2.60 has been released today. The OMD Labs Edition is based on the standard OMD but adds some more useful addons like Grafana and Prometheus or additional cores like Icinga 2 and Naemon. This release updates many of the shiped components and adds some interesting options when resolving update conflicts.
]]>The GitHub repository toschneck/openshift-example-bakery-ci-pipeline contains, the sourcecode for the examples of the talk Continuous Testing: Integration- und UI-Testing mit OpenShift-Build-Pipelines at the Redhat/ConSol OpenShift-Day:
]]>At ConSol we use GitLab as our central Git server and I am quite happy with its functionality. Lately, I have been playing around with GitLab CI with the objective of finding out if we can use it instead of Jenkins, our current CI server of choice.
Since most of our projects use Maven, I was particularly interested in setting up a simple Maven build job.
To cut a long story short, yes, I would use GitLab CI in my next project. We’ll later see why, but first I want to give a quick walkthrough of GitLab CI.
]]>Often users complained about the complexity of having to learn all about Citrus and the Spring framework in particular as Citrus uses Spring for configuration and dependency injection.
Especially non-developers had problems to master the learning curve for Citrus and Spring when starting to use the framework. Also people asked for a way to have a user interface for managing
components and tests.
We heard you and introduced a new administration user interface for Citrus! There is a detailed Citrus Admin documentation (which is still ongoing).
However I would like to outline the main features of that web UI here in a short post for you.
The Prometheus monitoring tool follows a white-box monitoring approach: Applications actively provide metrics about their internal state to the Prometheus server. In order to instrument an application with Prometheus metrics, you have to add a metrics library and use that library in the application’s source code. However, DevOps teams do not always have the option to modify the source code of the applications they are running.
Promagent is a Java agent using Bytecode manipulation for instrumenting Java Web applications without modifying their source code. Promagent allows you to get white-box metrics for Java Web applications even if these applications do not implement any metrics library out-of-the-box.
]]>OMD Labs Edition 2.40 for the Raspberry Pi has been released today. A month and a broken SD card (excessive use of /var/swap during the builds) after the release of the x86 version it is now possible to run a full-blown monitoring system on your ARM boards. It was tested on Raspberry 2 and Raspberry 3. If you want to run OMD on one of the older models, you might experience performance problems, especially when you enable InfluxDB and Grafana.
]]>OMD Labs Edition 2.40 has been released today. The OMD Labs Edition is based on the standard OMD but adds some more useful addons like Grafana and Influxdb or additional cores like Icinga 2 and Naemon. This releases focus is on security and maintainance and removes some recently discovered CVEs in Nagios, Icinga and Naemon.
]]>Sowohl End-2-End-Testing als auch End-2-End-Monitoring folgen dem gleichen Paradigma – sie betrachten eine Applikation aus der Sicht des End-Users. Hier darf es keine Rolle spielen, in welcher Oberflächentechnologie die Applikation geschrieben ist oder in welcher Art sie mit dem End-User in Verbindung tritt. Genau an diesem Punkt setzt das Open-Source-Tool Sakuli an.
]]>Typical Java backend applications need to integrate with existing 3rd party services. In most cases, calls to these 3rd party services are authenticated. Frequently, Java applications are required to use login credentials for authenticated calls: A username and a password.
This scenario raises a problem: How can we store the password needed for calling the 3rd party service? We could store it in a properties file, but then everyone with access to the properties file learns the password. We could provide the password as a command line parameter or environment variable, but then everyone with access to the startup script learns the password. We could hard-code it in our application, but then everyone with access to the JAR file learns the password. We could encrypt the password using a master key, but then we have the same problem again: How to store the master key?
The common solution is to use a secure data store provided by the operating system. Our application runs on Windows Server, so we use the Windows Data Protection API (DPAPI) for protecting our secret passwords. This blog post shows how to use the DPAPI in Java applications.
]]>DevoxxUS has been my first Devoxx outside of Europe so far. It was a total different Devoxx experience for me compared to the six times in Antwerp Belgium that I have been to in the past years.
Yet different it has been a great conference! I would like to share some of my adventures and thoughts in this post.
Mit steigender Zahl der im Ansible-Inventory gepflegten Hosts verlängert sich die Laufzeit eines Playbooks. Ansible erkennt zwar, welche Tasks nicht ausgeführt müssen (z.B. weil bestimmte Pakete bereits installiert sind), jedoch kostet auch diese Überprüfung Zeit. Früher oder später wird man deshalb den Playbook-Parameter --limit|-l
einsetzen - und sich wundern, warum Teile des Playbooks plötzlich nicht mehr funktionieren. Dieser Blogpost zeigt, in welche Probleme man laufen kann bzw. wie man sie vermeidet und löst.
If you ever needed to request HTTP resources with Java, you probably came across several solutions put together from a surprising number of lines. And you probably ended up with using a third party library to achieve your goal in a reasonable manner.
Good news: besides Java 9 modules, the next JDK version comes with a brand new HTTP client, and it not only brings support for HTTP/2, but also a sleek and comprehensive API. Let’s have a closer look at the new features.
]]>Dokumentation belegt in der Rangliste der beliebtesten Arbeiten eines Administrators sicher einen der hinteren Plätze. Neben der Beliebtheit der Aufgabe ist es auch mit zunehmender Anzahl der vorhandenen Systeme immer aufwändiger, die Dokumentation auf einem aktuellen Stand zu halten. Ein klassischer Fall also für Automatisierung.
Das Ziel in diesem Blog soll es sein, für jedes System eine DokuWiki Seite automatisch zu erzeugen. Weiter soll auf jeder Seite noch die Möglichkeit bestehen, individuelle Dokumentation mit einzufügen.
]]>Prometheus ist ein quelloffenes Monitoring- und Alarmierungs-Werkzeug. Seine Basis bildet eine Zeitreihen-Datenbank, auf deren Daten mit einer eingebauten, sehr mächtigen Abfragesprache zugegriffen werden kann.
Prometheus verfolgt den Ansatze des sogenannten “whitebox-monitoring”. Anwendungen stellen hier entweder nativ Metriken zur Verfügung, oder alternativ macht ein “exporter” Applikations- oder Geräte-Metriken für Prometheus abfragbar.
In diesem Artikel möchte ich zeigen, wie man mit Hilfe des fritzbox_exporter und des speedtest_exporter im Zusammenspiel mit Grafana Einblicke in die Performance seines Heimnetzwerks und seines Internetanschlusses bekommen kann. Die Hardware-Basis für dieses Projekt stellt ein RaspberryPi.
]]>The core of the most ELK applications is the Logstash configuration. A user defines here which data (inputs) is processed, how (filter) the data is processed and where it will go afterwards (outputs). Especilly this configuration contains a lot of logic which is unfortunally not easy to test. In this article I want to show you how to setup a testing environment for your Logstash configuration.
]]>In about three weeks DevoxxUS will take place in San Jose, California on March 21-23. After having visited Devoxx Belgium six
consecutive times this will be my first Devoxx conference outside of Europe. Once again I am honored
to be a speaker at that conference! After my Devoxx BE talk in 2015 (Testing Microservices with a Citrus twist) this is my second time speaking
in front of Devoxxians from all around the world. Fantastic!
This time I am going to talk about behavior driven integration with Cucumber and Citrus.
]]>Have you ever wondered what kind of patterns .gitignore
allows? Was it **/*/target
, target/*
or *target*
?? Read on and find out!
So, 2017 has arrived - this is the year when Java 9 will finally be released. And with it, the brand new module system called Jigsaw. In January, Marc Reinhold has announced that JDK 9 is feature complete, so we have every reason to be optimistic that the final release will actually ready in July. So it is about time to get acquainted with project Jigsaw, also known as Java 9 modules.
]]>Getting started with Kubernetes can be intimidating at first. Installing Kubernetes is not the easiest of tasks and can get quite frustrating.1 Luckily, there is an out-of-the box distribution called Minikube which makes toying around with Kubernetes a bliss.
As mentioned on Twitter by Roland Huß (Red Hat developer and former ConSol employee), if you are on Linux you can try kubeadm for a light-weight installation. ↩
The probably best written tests are those which can be understood by anyone understanding some English, right?
Hamcrest is an anagram of the word “Matchers” and a paradigm of encapsulating matching logic and corresponding error messages in objects we could use and reuse in the tests. They hide “matching”-implementation details and get self explanatory names we can seamless integrate in our tests. And of course we are also able to write tests for our matchers!
Hamcrest itself isn’t only intended to be used in the context of tests. It’s available for: Java, Python, Ruby, Objective-C, PHP, Erlang, Swift.
]]>At this year’s FOSDEM conference I did a 20 minutes presentation on how to implement tail -f
in Go. The video is available below.
Abstract: As part of a log file monitoring tool, I implemented a file tailer that keeps reading new lines from log files. This turned out to be much more challenging than I thought, especially because it should run on multiple operating systems and it should be robust against logrotate. In this 20 Minutes talk I will present the lessons learned, the pitfalls and dead-ends I ran into.
]]>Undertow is an open-source lightweight, flexible and performant Java server, they say. I can confirm that it’s
- lightweight: just have a look at those few lines of code to start a server and 1MB core JAR
- flexible: always feel free to provide your own implementations or use Undertow helpers to delegate usual server glue code to a more specific implementation you provide
I didn’t check or compare performance. It is the default server implementation of Wildfly Application Server and sponsored by JBoss.
]]>Der vollständige Artikel ist in der Java aktuell 01-2017 zu finden:
]]>OMD, die Open Monitoring Distribution, bildet heute in vielen Unternehmen das Rückgrat bei der Überwachung unterschiedlichster IT-Komponenten und Services. Für Anfänger ist OMD ein umfassendes Starterpaket, für Consultants eine solide Plattform für individuelle Monitoring-Landschaften. Seit dem Gründungsjahr 2010 wurde OMD kontinuierlich verbessert, mit der OMD-Labs-Edition wurden 2015 moderne Elemente wie InfluxDB und Grafana eingeführt. Das Thema Automatisierung wurde mittlerweile mit Ansible und Coshsh ebenso aufgegriffen. Der Wandel der IT-Welt in Richtung cloud-basierter Services und kurzlebigen Containern stellt eine besondere Herausforderung dar. Der Vortrag zeigt, wie OMD sich dieser in Zukunft stellen wird.
]]>Kürzlich wurden zwei Schwachstellen von Nagios veröffentlicht, u.a. bei heise.de. Wir verwenden Nagios als einen von mehreren möglichen Cores innerhalb des Monitoring-Frameworks OMD. Eine Gefährdung liegt nicht vor. Bei besagten Schwachstellen handelt es sich um:
CVE-2016-9565 - Betroffen ist das Web-Frontend von Nagios. Dieses zeigt nach dem Login einen RSS-Feed des Herstellers Nagios Enterprises an, dessen Inhalt so manipuliert werden kann, daß eingeschleuste Befehle im Kontext des www-data/nagios-Benutzers ausgeführt werden können. De Angreifer muss sich dazu jedoch als www.nagios.org ausgeben (durch einen DNS-Angriff) oder den Datenstrom als Man-in-the-Middle manipulieren. Abgesehen davon, daß die original Web-Gui von Nagios seit Erscheinen weitaus modernerer Oberflächen wie Thruk sowieso niemand mehr ernsthaft benutzt - die RSS-Funktionalität wurde bei OMD von Anfang an abgeschaltet bzw. rausgepatcht. Sie existiert schlichtweg nicht mehr und somit auch nicht die Schwachstelle.
CVE-2016-9566 - Bei diesem Exploit wird ausgenutzt, daß Nagios, so denn der Prozeß unter dem root-Account gestartet wird, das Logfile /usr/local/nagios/var/nagios.log o.ä. zunächst mit den entsprechenden root-Privilegien öffnet, bevor diese mittels des Systemcalls setgid(pid des nagios-Benutzers) aufgegeben werden. Ein Angreifer mit Zugang zum Monitoring-Server, welcher die Möglichkeit hat, das Logfile durch einen Symlink zu systemkritischen Dateien wie z.b. /etc/ld.so.preload zu ersetzen, kann die Voraussetzungen zur deren Manipulation schaffen. Dazu muss er noch dafür sorgen, daß Nagios schadhaften Inhalt in die Datei schreibt. Eine Möglichkeit wäre, ein externes Kommando (entsprechend präpariert) in die Command-Pipe zu schicken, was einen Eintrag im Logfile (und somit in /etc/ls.so.preload) zur Folge hat. Auch diese Form des Angriffs ist unter OMD ausgeschlossen, da ein Nagios-Prozess zu keinem Zeitpunkt mit root-Privilegien läuft. Monitoring mit OMD spielt sich ausschließlich im Kontext stinknormaler Benutzer ab.
Ergo: alles OK und grün.
]]>Accordingly, the two devrooms have combined CfPs, so that you can submit your container cloud talk in just one place. These devrooms are interested in talks about:
Submit Talk Proposals by November 26th on our CfP Page:
]]>Prometheus is an open source monitoring tool, which is conceptually based on Google’s internal Borgmon monitoring system. Unlike traditional tools like Nagios, Prometheus implements a white-box monitoring approach: Applications actively provide metrics, these metrics are stored in a time-series database, the time-series data is used as a source for generating alerts. Prometheus comes with a powerful query language allowing for statistical evaluation of metrics.
]]>Sakuli wird für EndToEnd mit Linux und Windows Applikationen bereits vielfach eingesetzt. Wie sieht es aber mit Android, dem verbreitetsten mobilen Betriebssystem, aus? Hierzu ein Beispiel.
]]>Wenn man einen Dienst überwachen möchte und man diesen nicht selbst betreut, fehlt meist die Erfahrung, wie sich dieser verhalten sollte und was als „normal“ gilt. Im Folgenden wird beschrieben, wie man (Un)Regelmäßigkeiten automatisch erkennen lassen kann.
]]>Der JUG Saxony Day fand am 30.09.2016 im Konferenzzentrum Radisson Blu Park Hotel in Dresden statt. Die von Anfang an gute und entspannte Atmosphäre beeindruckte ebenso wie die Auswahl der Vorträge. Insgesamt waren es über 30 Vorträge in 5 parallelen Tracks, die sowohl die aktuellen Trends in der Container-Technologie behandelten, Überblick über die neuesten Testing-Konzepte zeigten als auch einen Ausblick auf das zukünftige JDK 9 in petto hatten.
]]>Oft kommt die Frage auf ob man mit den Performancedaten, die von Nagios und ähnlichen System erhoben werden, nicht auch Vorhersagen treffen kann, etwa wie sich die Systeme in den nächsten Tagen und Wochen entwickeln. Aus diesem Grund wird im Folgenden vorgestellt, wie man dies erreichen kann.
]]>Kiel, 24 Grad, 50 Mann an Bord. Bei unerwartet schönstem Sommerwetter wurde in der Kieler Fachhochschule am 7. und 8. September der elfte Workshop der Monitoring-Community veranstaltet. Das ConSol-Monitoringteam trug mit acht Vorträgen zum Gelingen der Veranstaltung bei. Eine kurze Zusammenfassung:
Bereits mit dem erstem Vortrag nach der Begrüßung, “E2E-Monitoring mit Sakuli”, sorgte Simon Meggle für einen würdigen und technisch anspruchsvollen Auftakt der Veranstaltung. Die Möglichkeit, Sakuli in Docker-Containern einzusetzen und End-to-End-Tests somit praktisch beliebig zu parallelisieren, sorgte für viel Gesprächsstoff.
Damit es jeder zu Hause nachmachen kann, führte Simon dann am zweiten Tag die Teilnehmer in einer Live-Demo durch sein Tutorial “Sakuli-Tests im Docker-Container”.
]]>PromCon 2016 was the first conference around the Prometheus monitoring system. It took place from August 25 - 26 2016 at Google Berlin as a single-track event with space for 80 attendants.
We took the opportunity and did a lightning talk introducing grok_exporter, which is a tool for extracting Prometheus metrics from application logs.
]]>Counting the number of error messages in log files and providing the counters to Prometheus is one of the main uses of grok_exporter, a tool that we introduced in the previous post.
The counters are collected by the Prometheus server, and are evaluated using Prometheus’ query language. The query results can be visualized in Grafana dashboards, and they are the basis for defining alerts.
We found that evaluating error counters in Prometheus has some unexpected pitfalls, especially because Prometheus’ increase() function is somewhat counterintuitive for that purpose. This post describes our lessons learned when using increase() for evaluating error counters in Prometheus.
]]>Am 27.7. fand bei ConSol das Sommer-Meetup der Gruppe “Münchner Monitoring-Stammtisch” statt. Das Thema war diesmal “Ansible im Monitoring-Umfeld”.
Ansible ist ein Framework, mit dem üblicherweise Server nach der Grundinstallation nachkonfiguriert und mit ausgewählten Softwarepaketen versorgt werden. Oder mit dem im laufenden Betrieb immer wieder Patches und sonstige Updates ausgerollt werden. Dabei wird in einem sogenannten Ansible-Playbook lediglich der Soll-Zustand beschrieben und Ansible kümmert sich im Hintergrund um die dazu nötigen Aktionen. Das hat grundsätzlich noch nichts mit Monitoring zu tun, aber da wir über den Tellerrand hinausschauen und bei allen Kunden keine Insel installieren, sondern Teil einer Unternehmens-IT mit allen möglichen Verflechtungen sind, gehört Ansible seit längerem zum Werkzeugkasten des ConSol-Monitoring-Teams. Es gibt übrigens auch eine eigene Ansible-Meetup-Gruppe, die unsere Veranstaltung freundlicherweise auch auf ihrer Seite ankündigte.
Die Fachsimpelei bei Augustiner und Pizza wurde immer wieder durch einen Vortrag unterbrochen, als da waren:
Prometheus is an open-source systems monitoring and alerting toolkit. At its core, Prometheus uses time-series data, and provides a powerful query language to analyze that data. Most Prometheus deployments integrate Grafana dashboards and an alert manager.
Prometheus is mainly intended for white box monitoring: Applications either provide Prometheus metrics natively, or they are instrumented with an exporter to make application-specific metrics available.
For some applications, parsing log files is the only way to acquire metrics. The grok_exporter is a generic Prometheus exporter extracting metrics from arbitrary unstructured log data.
This post shows how to use grok_exporter to extract metrics from log files and make them available to the Prometheus monitoring toolkit.
]]>$ check_mssql_health --hostname dbsrv1 --port 1433 \
--username sa --password 'Str3ng!g3heim' \
--mode create-monitoring-user \
--name NAGIOS --name2 'ES_Ku_el'
Anstelle des Benutzers sa kann man auch jeden beliebigen Administrator-Account nehmen. NAGIOS wird in jeder einzelnen Datenbank angelegt. Kommen neue Datenbanken dazu, so wiederholt man einfach den create-monitoring-user-Befehl.
]]>$ check_wut_health --hostname dcenv2.de.xxxx --community public --mode sensor-status
OK - return air temperature Unit 1.1 is 21.40C, humidity Unit 1.1 is 49.40%, return air temperature Unit 2.1 is 22.40C, humidity Unit 2.1 is 46.80% | 'temp_Unit 1.1'=21.40;25;28;; 'hum_Unit 1.1'=49.40%;40:60;35:65;0;100 'temp_Unit 2.1'=22.40;25;28;; 'hum_Unit 2.1'=46.80%;40:60;35:65;0;100
Wir sehen hier die hartcodierten Default-Schwellwerte 25 und 28 für die Temperatur bzw. 40:60 und 35:65 für die Luftfeuchtigkeit.
Bisher gab es zwei Möglichkeiten, diese zu ändern, z.b. in 20 und 30 für die Temperaturen zu ändern.
This post shows how to use Packer for automatically executing code snippets from Markdown files on a variety of platforms. Machine images are created directly from the code snippets in the documentation. That way, documentation is guaranteed to be up-to-date and complete, and it can be integrated in an automated delivery pipeline.
]]>If you haven’t read the first article don’t worry. A quick summary of all the important bits will be shown shortly below. But before I get to that lets talk a little bit about automated integration testing and citrus.
One of the biggest challenges when testing any application is being able to simulate all endpoints.
]]>A couple of years have passed since we last looked into in-memory caches here at ConSol. In that time a bunch of things have happened:
Probably the most significant thing that happened was that the oldest Java Service Request JSR 107, also known as JCache, finally reached ‘Release’ status. This JSR was a long time in the making taking a whole 13 years since the initial proposal back in 2001.
Grid Gains In-memory Data Fabric became an open source project and is now available under the Apache Foundation Project and known as Apache Ignite.
The existing In-memory caches providers, like Hazelcast, have received a whole host of new features including things like support for distributed transactions, a new Map-Reduce API, interceptors for executing business logic, when the cache entries change, to mention just a few.
Download and check it out sakuli-v0.9.2-installer.jar!
]]>Einen ausführlichen Vortrag vom Autor von Nagflux und Histou, Philip Griesbacher, wird es auf der diesjährigen OSMC geben.
Das Aktivieren des kompletten Gespanns ist ab der Version omd-2.01.20151021-labs-edition aus unserem Testing-Repository in einer OMD site sehr einfach möglich. Erfahrene OMD-Benutzer verwenden die folgenden Kommandos, für OMD-Einsteiger gibt es die ausführlichere bebilderte Anleitung weiter unten.
omd config set PNP4NAGIOS off
omd config set GRAFANA on
omd config set INFLUXDB on
omd config set NAGFLUX on
Unter https://www.it-bei-lidl.com/ findet sich eine Stellenausschreibung für den Bereich Geschäftsprozess-Monitoring. Ich habe das technische und menschliche Umfeld von Lidl kennengelernt und kann nur empfehlen, sich dort zu bewerben. Es erwartet einen eine tiptop gemanagte IT-Landschaft, die so ziemlich jede zeitgemäße Technologie umfasst. Und natürlich Monitoring made by ConSol.
Und jetzt kommt Werbung….
]]>$ check_nwc_health --hostname 10.37.6.2 --community kaas \
--mode interface-health --name FastEthernet0/0
OK - FastEthernet0/0 is up/up, interface FastEthernet0/0 usage is in:0.01% (12041.88Bits/s) out:0.00% (1435.76Bits/s), interface FastEthernet0/0 errors in:0.00/s out:0.00/s , interface FastEthernet0/0 discards in:0.00/s out:0.00/s | 'FastEthernet0/0_usage_in'=0.01%;80;90;0;100 'FastEthernet0/0_usage_out'=0.00%;80;90;0;100 'FastEthernet0/0_traffic_in'=12041.88;80000000;90000000;0;100000000 'FastEthernet0/0_traffic_out'=1435.76;80000000;90000000;0;100000000 'FastEthernet0/0_errors_in'=0;1;10;; 'FastEthernet0/0_errors_out'=0;1;10;; 'FastEthernet0/0_discards_in'=0;1;10;; 'FastEthernet0/0_discards_out'=0;1;10;;
Mit check_mailbox_health lassen sich so auch nicht ganz triviale, auf Mail basierende Geschäftsvorgänge monitoren.
]]>define command {
command_name check_mssql_health
command_line $USER1$/check_mssql_health \--hostname $ARG1$ \--username '$ARG2$' \--password '$ARG3$' ...
}
schließt zwar den ganzen Dreck in einfache Hochkommas ein, aber was, wenn das Passwort selber ein Hochkomma enthält?
Current Status: | WARNING (for 0d 0h 6m 3s) |
Status Information: | [sh: -c: line 0: unexpected EOF while looking for matching `'' |
sh: -c: line 1: syntax error: unexpected end of file] |
Damit das nicht passiert und auch die Icinga-Konfigurationsdateien von Sonder- und Schmierzeichen aller Art verschont bleiben, können die Plugins aus der check_*_health-Familie sowie check_hpasm seit den letzten Releases mit encodierten Passwörtern versorgt werden. Man hantiert also nur noch mit [A-Za-z0-9].
]]>Eine neue Ausgabe der ConSol-Monitoring-Minutes ist seit heute bei Youtube online. Matthias Gallinger erklärt, wie man in einer DMZ einen Gearman-Worker einrichtet, ohne daß man sich beim Firewall-Admin unbeliebt macht.
]]>Additionally, I introduced my personal workflow when working on small scale features, let’s say the size of one commit to the main line. Some of my colleagues found this workflow to be particularly interesting, so I’d like to share it here and discuss its benefits and drawbacks.
]]>wget -qO- https://get.docker.com/ | sudo sh
So in a series of posts I would like to talk about integration testing strategies for Apache Camel projects using the Citrus integration test framework.
]]>The talks and the catering were very well organized. The only drawback was, that the WLAN wasn’t working most of the time.
Now lets go through the talks:
]]>However, this time it is different: At Google’s booth at the exhibition area we got their latest Cardboard gadget. Cardboard is a virtual reality viewer for Android phones and it is absolutely the greatest thing I have ever seen on a phone. The Cardboard app comes with a lot of fancy demos like a virtual reality tour through Versailles, flying around in Google earth and even a short animated 360° movie.
For me Devoxx did not stop when I left the venue this afternoon. Devoxx continued at home when I opened that Cardboard give-away. Infinite possibilities, the motto of this year’s Devoxx, couldn’t fit better. I definitely need to check it out and learn more about it.
Thank you very much for that, Google! (fabian)
See you next year, at the Devoxx. But before that lets have a look at the last day and a very inspiring talk on Android Wear:
]]>Now let’s go through the talks of day 4 in Antwerp.
]]>Devoxx ignite sessions are a great thing: Each speaker has 20 slides in 5 minutes, the slides are auto-forwarding, so each slide is up 15 seconds. During the hour long ignite session you would hear 8 talks. Today, we learned how to make money, ride a mountain bike, do performance tuning, save the planet, be a diabolical developer, share a house, do open source, decode the airspace, and why Stephen Chin’s job sucks.
The format reminds a bit of TED’s talks, talks are quick, innovative, and engaging. Sometimes I even felt that the take away of a five minute talk is not necessarily less than the take away of the three hour university sessions.
]]>Stephan has some great announcements in his keynote. One of them is to welcome Devoxx Poland as new family member in Krakow next year, which is indeed great news for our ConSol colleagues in Poland.
]]>So here is the wrap up of Devoxx Day 2:
]]>So be prepared to receive some on site summaries of what we have seen and what inspired us here.
]]># CentOS 7 64bit
rpm -i http://download.fedoraproject.org/pub/epel/7/x86_64/epel-release-7-2.noarch.rpm
# CentOS 6 32bit
rpm -i http://download.fedoraproject.org/pub/epel/6/i386/epel-release-6-8.noarch.rpm
# CentOS 6 64bit
rpm -i http://download.fedoraproject.org/pub/epel/6/x86_64/epel-release-6-8.noarch.rpm
# CentOS 5 32bit
rpm -i http://download.fedoraproject.org/pub/epel/5/i386/epel-release-5-4.noarch.rpm
# CentOS 5 64bit
rpm -i http://download.fedoraproject.org/pub/epel/5/x86_64/epel-release-5-4.noarch.rpm
]]>die wir unter dem Namen “Sakuli” über ihre gemeinsame API zu einem Team zusammenspannt und auf GitHub veröffentlicht haben.
]]>Update 23.6.14: im Git von check_mk wurde mein Patch mittlerweile eingespielt.
Update 26.6.14: im Git von Netways auch.
Update: Die beiden angemeckerten Plugins sind (Stand 26.6.14) gefixt und somit ist meiner Stänkerei jede Grundlage entzogen. Alles ist gut :-)
]]>
In Part I of this tutorial I introduced the basic concepts and benefits of Citrus as a test driver for ESB projects in general and webMethods in particular. In this second part I want to discuss some Citrus project setup options and provide a quickstart template project for Ant users.
]]>With the new configuration components we give credit to all users continuously giving us feedback on the Citrus configuration. With 1.4 our primary goal was to simplify the configuration without loosing the great extendability and customization capabilities of Citrus.
If you are coming from Citrus 1.x we have summarized the configuration changes in this migration sheet.
The old Citrus configuration components were marked as deprecated, so you can continue to use those components when upgrading to 1.4 without any changes. However you should consider to upgrade to the new endpoint configuration in order to be ready for the upcoming versions.
Also have a look at the new config sheet to see how the new configuration works for you.
]]>Continuous integration is almost mainstream nowadays. Probably no one wants to argue against the value of having an all-embracing integration test suite in place, which is lightweight enough to be executed on each code change. In this blog series I want to show the interplay between Citrus, the integration test framework written and maintained by ConSol and a commonly used Enterprise Service Bus, the webMethods Integration Server.
]]>Der Verlag Packt Publishing ist an mich herangetreten und hat mich gebeten, eine Rezension zum soeben erschienenen Buch Icinga Network Monitoring von Viranch Mehta zu schreiben.
Eigentlich hatte ich keine Zeit, aber wenn mir jemand mit „Keeping in mind your knowledge in this subject and having looked at your contributions, I feel you'd make an excellent reviewer of this book.“ kommt, dann werde ich natürlich schwach.
Das Buch richtet sich an eine Leserschaft, die bisher keinen Kontakt zur Icinga (bzw. Nagios, Naemon oder Shinken) hatte. Linux-Kenntnisse werden aber dennoch vorausgesetzt. Ziel des Autors war es, eine nachvollziehbare (im Sinne von: sofort am Rechner umsetzbar) und möglichst vollständige Anleitung zu erstellen, anhand derer ein Icinga-Neuling (mit ein bisschen Hirnschmalz sind die Schritte aber auch auf die o.g. Geschwister von Icinga anwendbar) in kurzer Zeit ein Basis-Monitoring für seine IT-Landschaft aufsetzen kann.
]]>$line =~ /Fatal: error (\d+) occured/;
$errorcode = $1;
Bei check_logfiles kann dies benutzt werden, um aus Trefferzeilen die relevanten Teilstrings zu extrahieren und so die Ausgabe des Plugins zu verkürzen.
]]>In this blog post we’d like to share the projects we came up with:
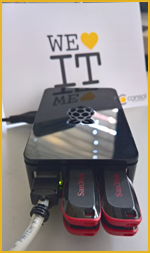
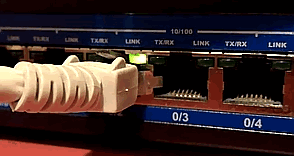
There seem to be a lot of interest in building Raspberry Pi clusters for
demo
projects.
One of the teams took the chance and built our own, with five Pis running an Infinispan distributed cache.
It turns out that having a real hardware cluster yields different results than testing Infinispan locally.
While clean shutdowns and startups are no problem, unplugging and plugging network cables is a much greater challange to the Infinispan infrastructure.
The Raspberry Pi hardware is sufficient to run embedded Infinispan instances, the JBoss based distributions don’t seem to fit well with the hardware.
The Raspberry Pi and a large screen is all that is needed for building an information kiosk.
One of the teams built a kiosk for our entrance hall, showing the current event schedule for our meeting rooms.
Access to the event database was implemented as a Spring application, on the front-end side
HTML5 and JavaScript magic was used to visualize the data.
Ceylon 1.0.0 was released recently, and one of the teams took the chance to make some first experiences with the new programming language.
Ceylon runs on the JVM, and can also be compiled to JavaScript. It comes with an Eclipse-based IDE, which is, however, not very easy to run.
The strong type system enables a lot of tool support, but sometimes also results in errors that are hard to understand for the novice.
The ConSol academy is a company event where employees share their knowledge with their peers. One team used the FedEx day to build
a prototypical hardware for recording academy talks on video, to archive the talks for colleagues who cannot participate.
As most other project, the video recording hardware was also based on the Raspberry Pi.
The Pi was equipped with a small camera and a microphone, and streams the data over the network for recording.
The Raspberry Pi is currently the most popular thing
among our developers. It is easy to set up, and provides an open platform for a wide range of projects.
The FedEx day was a great opportunity to experiment with that, and it is also a good way to get together with colleagues who work in other projects.
This version contains lots of updated packages including Thruk 1.80, Mod-Gearman 1.4.14, NagVis 1.8, check_mk 1.2.2p3 and many more.
Using the OMD Repository installation is as simple as a apt-get install omd. If you have an rpm-based system, it's as simple as yum install omd or zypper install omd.
]]>Slides can be found here: http://rawgithub.com/ConSol/reveal.js/2013-jbossOneDayTalk/index.html.
See you tomorrow!
]]>root@raspberrypi:~# apt-get install omd-1.00
Die Maschinen unserer Kunden, auf denen wir uns tagtäglich bewegen und Monitoring-Systeme betreiben, haben üblicherweise CPUs und Gigabytes im zweistelligen Bereich. Da wird es schon zur Geduldsprobe, wenn ein Build auf dem Raspberry Pi den halben Tag braucht. Ein ARM11 ist eben kein Xeon und SD ist nicht SSD.
]]>Der eine oder andere check_nwc_health-Anwender dürfte --mode walk schon kennen. Damit kann man sich eine Liste von snmpwalk-Anweisungen ausgeben lassen, deren Resultat mir beim Debugging hilft.
Dr. Fabian Stäber gave a talk a JayDay 2013 where he introduced and compared the leading distributed cache implementations:
Based on a simple example application, the basic functionality is presented, and the specific strengths and weaknesses of the different cache architectures are highlighted and compared.
The results of this ‘shootout’ and an executive summary can be found here at /java-caches and the example application is available from GitHub.
]]>This version contains lots of updated packages including Nagios 3.5.0, Shinken 1.4, Multisite 1.2.2p2, Thruk 1.72, PNP4Nagios 0.6.21, NagVis 1.7.1, check_mk 1.2.2p2 and many more.
Using the OMD Repository installation is as simple as a apt-get install omd. If you have an rpm-based system, it's as simple as yum install omd or zypper install omd.
For those who weren't using OMD yet, now there is no more reason to hesitate.
]]>Die fünfte Ausgabe der ConSol Monitoring Minutes, die sich mit diesem Thema befasst, ist heute ebenfalls entstanden.
]]>$USER1$/negate --warning=CRITICAL $USER1$/check_vmware_api.pl ....
Leider machte mir etwas anderes einen Strich durch die Rechnung. check_vmware_api.pl schreibt nämlich eine Warnung auf STDERR raus:
Subroutine IO::Socket::INET6::sockaddr_in6 redefined at /omd/sites/sagichnicht/lib/perl5/lib/perl5/Exporter.pm line 66. at /usr/lib/perl5/vendor_perl/5.10.0/Socket/INET6.pm line 21
]]>
check_jmx4perl
.
]]>Soeben erschienen: die zweite Folge der ConSol Monitoring Minutes. Getreu unserem Motto “aus der Praxis für die Praxis” zeigen wir darin live, wie die Checks einer großen Nagios-Installation (hier: einer OMD-Site) mit Mod-Gearman an Worker delegiert werden können.
Beim “Schweizer Taschenmesser” OMD (erhältlich über das ConSol-Repository) ist Mod-Gearman bereits integriert.
]]>
Blue Coat ProxyNG Appliances sollten überwacht werden, genauer gesagt das Modell SG600. Diese Appliances finden Verwendung in Application Delivery Networks (ADN), wo sie für die performante Auslieferung von Geschäftsanwendungen und Schutz vor web-basierten Bedrohungen sorgen.
Und jetzt zum Monitoring…
Anlässlich der neuen Videoserie "ConSol Monitoring Minutes" habe ich mir überlegt, wie man die Zahl der Zugriffe auf ein YouTube-Video mit einem Nagios-Plugin auslesen und mit PNP4Nagios aufzeichnen kann. Ein eigenes Plugin müsste dazu die Informationen herunterladen, Kennzahlen aus dem Resultat herausparsen, ausgeben und nicht zuletzt irgendwie auf Download-Fehler reagieren. Mit check_logfiles, einer kleinen Konfigurationsdatei und der YouTube-API ist das aber kein Problem.
]]>Die erste Folge der ConSol "Monitoring Minutes" ist soeben auf YouTube erschienen;
darin geben wir einen Überblick über den Aufbau und die Funktionsweise von OMD und zeigen zuletzt, wie OMD mit wenigen Handgriffen über die Repositories von ConSol installiert und aktualisiert werden kann.
Hier gehts zur ersten Folge: OMD im Überblick - ConSol Monitoring Minutes
Monday and Tuesday are traditionally the days for the University talks
with in-depth coverage of certain topics.
check_jmx4perl
im Speziellen. Roland Huß als Referent unt Author von jmx4perl und Gerhard Laußer als Moderator erklären 45 Minuten, wie man Nagios am besten mit JEE Servern zusammenbekommt:
In normal installations there is an rc script in /etc/init.d/thruk which fakes a request and makes the fastcgi server start.
root@mo:~ #> /etc/init.d/thruk start Starting thruk.........(10492) OK
In OMD its even easier, latest snapshots have so called ‘init-hooks’ which are executed after the rc script. You
need to create two files in your site:
One of them can be a symlink, because both files will have the same content:
#!/bin/sh # check return code of apache start if [ $4 = 0 ]; then ./etc/init.d/thruk start fi
So when ever your apache starts / reloads, for example after logfile rotation, thruk will immediatly start too.
]]>Aus der Erfahrung von über einem Dutzend individueller Workshops haben
wir einen Intensivkurs destilliert, der in Bezug auf die Nagios-Anbindung von JEE-Applikationsservern keine Fragen mehr offen lässt.
In dieser Schulung lernen Administratoren, das Maximum aus Jmx4Perl
herauszuholen. Neben theoretischen Grundlagen wird vor allem viel Wert
auf praktische Übungen gelegt.
Weiterer Details zum Inhalt und eine Online-Anmeldung finden sich
unter
http://www.consol.de/allgemein/schulung-java-monitoring-mit-nagios/
Fragen zu dem Kurs beantworten wir auch gerne hier in den Kommentaren
oder im Forum.
This is how it looks:
13:46:50 sven@tsui:~/projects/Thruk (master) %>
All you need is a simple function in your .bashrc
]]>check_by_ssh --host 10.177.3.39 --logname nagios \
--command "lib/nagios/plugins/check_swap -w 15% -c 8%"
The drawback of this method is extra load on the nagios server. With every check, a ssh process is forked which has to do a complete handshake with the remote side. With newer ssh implementations it is possible to have a persistent connection which requires only one handshake at startup. All the following ssh connects use the already established connection, which saves a lot of cpu cycles.
Here are the instructions to combine check_by_ssh with such a persistent tunnel.
Thats where recurring downtimes will become handy and latest Thruk Version includes this new feature.
]]>The addresses of the livestatus backends have to be written into a config file, thruk_local.cfg. Now what if my list of 13 sites would be constantly changing? What if new OMD sites would be created, others deleted on a daily basis? I would have to edit the config file every time. With the new init-hook-feature, OMD will do this automatically for me.
]]>I often get asked if there are any benchmarks for Thruk so i finally decided to do some tests.
Event: 26 Added: 03/08/2011 21:01
CAUTION: POST Messages - POST Error: 207-Memory initialization error on Processor 1 DIMM 6. The operating system may not have access to all of the memory installed in the system..
check_oracle_health --username <user> --password <pass> --connect <sid>
auf. Voraussetzung dafür ist natürlich, dass die SID in einem Verzeichnisdienst oder in einer Datei tnsnames.ora vorhanden sein muss.
]]>Citrus 1.2.M2 now works with Spring 3.0, Spring Integration 2.0 and Spring WS 2.0. In addition to that we have some bugfixes and improvements in this release. Check out the reference documentation for the complete changes list on what’s new.
]]>While Jolokia got some minor enhancements, Jmx4Perl now finally got rid of any Java code, relying now completely on a Jolokia agent.
]]>JMX::Jmx4Perl
beleuchtet.
Die Ausgabe lässt sich online für 6 € inkl. Versandkosten bestellen. Fragen zu dem Artikel bzw. jmx4perl im Allgemeinen beantworte ich in den Kommentaren hier gerne.
]]><Include href="..." xmlns="http://www.w3.org/2004/08/xop/include"/>
. Validation is quite easy when you’re still mock testing your application because you have full control over what your mock response will look like.
]]>check_jmx4perl
has support for configuration files. JMX Nagios checks are now considerably simpler to configure and multi checks add even more performance and flexibility.
]]>check_jmx4perl
, a new Java client library and the start of a readline based JMX shell j4psh
with syntax highlighting and command line completion.
]]>Jetzt kam von den Admin die Anfrage ob es nicht möglich ist alle Meldungen (winwarncrit) erstmal als Warning an Nagios zu melden, um dann bestimmte Meldungen nach und nach als Critical einzustufen, oder komplett zu verwerfen (exclude).
Geht das?
$ check_nagios_external_commands -t 120 -p /usr/local/nagios/var/rw/nagios.cmd \
-l /usr/local/nagios/var/nagios.log
WARNING - command took 23s|command_write=0.85s command_read=22s
Download: ndo2db
]]>But wait, there is more … ;-)
]]>]]>
]]>
The latest version now supports multi-threaded performance tests. We recently tested a SOAP WebService regarding performance using Citrus. I will try to add a new post describing how to accomplish performance testing with Citrus as soon as possible.
Download the latest snapshot version of Citrus: Download
New features in first 1.1-SNAPSHOT release:
Testing the latest snapshot version including feedback is now very important for us. Therefore we hope you can switch to the latest snapshot versions. There are still more features to come in version 1.1 so stay tuned. For instance by following Citrus on Twitter (http://twitter.com/citrusframework) where all announcements will reach you right on time.
]]>Add the repos to your project POM. Here’s an example for the release repository:
<repository>
<id>consol-labs-release</id>
<url>http://labs.consol.de/maven/repository/</url>
<snapshots>
<enabled>false</enabled>
</snapshots>
<releases>
<enabled>true</enabled>
</releases>
</repository>
<repository>
<id>consol-labs-snapshots</id>
<url>http://labs.consol.de/maven/snapshots-repository/</url>
<snapshots>
<enabled>true</enabled> <!-- Policy: always, daily, interval:xxx (xxx=#minutes, 60*24*7=10080), never -->
<updatePolicy>interval:10080</updatePolicy>
</snapshots>
<releases>
<enabled>false</enabled>
</releases>
</repository>
Simply add this profile to your project, and activate it when deploying:
<profile>
<id>dist-labs</id>
<distributionManagement>
<repository>
<id>consol-labs-release</id>
<url>scpexe://labs.consol.de/home/maven-repository/www/htdocs/repository</url>
</repository>
<snapshotRepository>
<id>consol-labs-snapshots</id>
<url>scpexe://labs.consol.de/home/maven-repository/www/htdocs/snapshots-repository</url>
</snapshotRepository>
</distributionManagement>
</profile>
Additionally, you’ll have to modify your $HOME/.m2/settings.xml and configure the user for SSH deployment:
<server>
<id>consol-labs-release</id>
<username>maven-repository</username>
</server>
<server>
<id>consol-labs-snapshots</id>
<username>maven-repository</username>
</server>
Now you can simply deploy using Maven:
mvn clean install deploy -Pdist-labs
Note: We only support SSH transport for now, using SSH authorized keys.
]]>