


The Tutorial “Docker based E2E application monitoring with Xfce UI and OMD Labs” describes how to:
Sources: see github.com/ConSol/sakuli-examples
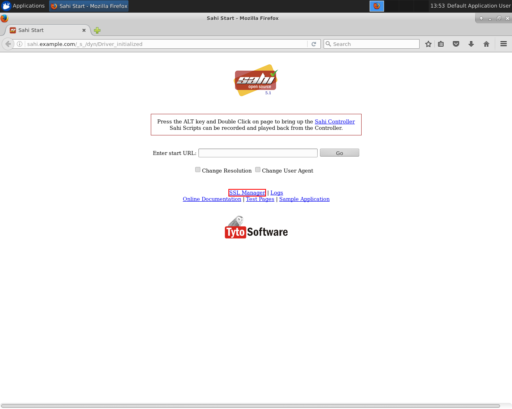
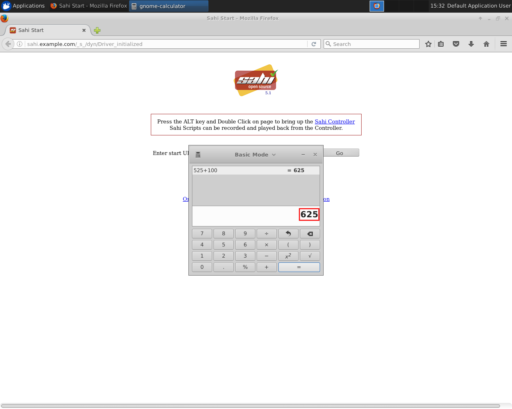
First we wan’t to create a simple Sakuli test and execute in two different containerized UIs. The test should first validate the starting page of the sahi web testing component. Afterwards it should open the Gnome Calculator and calculate 525 + 100 and validate the Result of 625. At least the test should open gedit and paste there a message for us that all went fine.
Web testing component: Sahi starting page.
Native UI component: Gnome Calculator + gedit.
The implementation of the test case is very simple, you can just mix web and native testing methods. Take a look at the file: part_01/example_xfce/case1/sakuli_demo.js.
_dynamicInclude($includeFolder);
var testCase = new TestCase(40, 60);
var env = new Environment();
var screen = new Region();
var appCalc = new Application("/usr/bin/gnome-calculator");
var appGedit = new Application("/usr/bin/gedit");

function checkCentOS() {
    var dist = env.runCommand('cat /etc/os-release').getOutput();
    if (dist.match(/NAME=.*CentOS.*/)) {
        Logger.logInfo('Detected distribution: CentOS  >> overwrite some image patterns');
        testCase.addImagePaths("centos");
    }
}

try {
    checkCentOS();
    _highlight(_link(/SSL M.*/));
    _highlight(_link("Logs"));
    _highlight(_link("Online Documentation"));
    _highlight(_link("Test Pages"));
    _highlight(_link("Sample Application"));
    testCase.endOfStep("Test Sahi landing page", 10);
    appCalc.open();

    screen.waitForImage("calculator.png", 5).highlight().mouseMove();

    env.type("525");
    env.sleep(2);
    var calcRegion = appCalc.getRegion();
    calcRegion.find("plus.png").click().type("100");
    calcRegion.find("result.png").click();
    screen.waitForImage("625", 5);
    testCase.endOfStep("Calculation", 20);

    appGedit.open();
    screen.waitForImage("gedit.png", 10);
    env.paste("Initial test passed. Sakuli, Sahi and Sikuli seem to work fine. Exiting...");
    testCase.endOfStep("Editor", 20);

} catch (e) {
    testCase.handleException(e);
} finally {
    // env.sleep(99999999); // usefull to block the execution at the end
    appCalc.close(true); //silent
    appGedit.kill(true);  //silent, without exit prompt
    testCase.saveResult();
}
The method checkCentOS just makes a small native Linux command to define in witch operating system the test will be executed. If the operating system is CentOS Sakuli will load the screenshot images from the folder part_01/example_xfce/case1/centos and overwrite the default images defined in part_01/example_xfce/case1.
There are some testCase.endOfStep("<step_name>", <step_waring_time>) function calls. There you define that all statements above belong to one test step. The integer value for <step_warning_time> defines what’s the maximum time in seconds for executing the above test. If the step breaks the threshold, Sakuli will end in the the state warning in step. In Part 2, we will see the values represented in a grafana graph.
To define a warning time for the test case, the TestCase object have been used:
var testCase = new TestCase(40, 60);The second threshold of 60 seconds, define the critical time. It’s also possible define a global waring and critical times for the whole test suite in the file /part_01/example_xfce/testsuite.properties, if you have more testcases. After all you get this data model:
TestSuite: example_xfce, warning time: 50, critical time: 70
|---- TestCase: case1, warning time: 40, critical time: 60
      |---- TestStep: Test Sahi landing page, warning time: 10
      |---- TestStep: Calculation, warning time: 20
      |---- TestStep: Editor, warning time: 20
Now we can configure the runtime environment there we use the Docker image consol/sakuli-ubuntu-xfce and for the second environment consol/sakuli-centos-xfce container where we mount in our test case definition. To make it easy to start the container, we used Docker Compose to define the setup in the file part_01/docker-compose.yml:
sakuli_test_ubuntu_firefox:
  image: consol/sakuli-ubuntu-xfce:dev
  volumes:
  - .:/opt/test
  ports:
  - 5911:5901
  - 6911:6901
  user: '1000'
  command: run /opt/test/example_xfce

sakuli_test_centos_chrome:
  image: consol/sakuli-centos-xfce:dev
  volumes:
  - .:/opt/test
  ports:
  - 5912:5901
  - 6912:6901
  user: '1000'
  command: run /opt/test/example_xfce -browser chrome
Note
If you get the exception
java.nio.file.AccessDeniedException: /opt/test/example_xfce/_logsplease ensure that you local files have the correct file permissions. If you not sure you can runchmod a+rw -R .or changeuser: 1000to your own user id (executeid -u). Alternatively you can use the root useruser: '0'.
To start the both testcases in parallel simply execute:
$ cd part_01
$ docker-compose up --force-recreate
During the execution you can open the VNC Overview Page to watch the test case execution in live via VNC. The CLI option --force-recreate is needed to force Docker Compose to truly start a fresh container instance of the image.
After the execution will find two finished containers:
$ docker-compose ps
               Name                              Command               State    Ports
 ---------------------------------------------------------------------------------
part01_sakuli_test_centos_chrome_1    /dockerstartup/startup.sh  ...   Exit 0
part01_sakuli_test_ubuntu_firefox_1   /dockerstartup/startup.sh  ...   Exit 0
To evaluate if all went fine, just verify the exit code is not 0 or the logs at part_01/example_xfce/_logs/_sakuli.log. Another possibility is to look at the docker logs e.g.
$ docker logs part01_sakuli_test_ubuntu_firefox_1
....
=========== RESULT of SAKULI Testsuite "example_xfce" - OK =================
test suite id: example_xfce
guid: example_xfce__2017_09_29_13_41_20_233
name: example test suite inside of the Xfce desktop for Sakuli
RESULT STATE: OK
result code: 0
db primary key: -1
duration: 29.311 sec.
warning time: 50 sec.
critical time: 70 sec.
start time: 29-09-2017 13:41:20
end time: 29-09-2017 13:41:49
db primary key of job table: -1
browser: Mozilla/5.0 (X11, Linux x86_64, rv:45.0) Gecko/20100101 Firefox/45.0
        ======== test case "case1" ended with OK =================
        test case id: case1
        name: case1
        RESULT STATE: OK
        result code: 0
        db primary key: -1
        duration: 17.318 sec.
        warning time: 40 sec.
        critical time: 60 sec.
        start time: 29-09-2017 13:41:27
        end time: 29-09-2017 13:41:45
        start URL: http://sahi.example.com/_s_/dyn/Driver_initialized
        last URL: http://sahi.example.com/_s_/dyn/Driver_initialized
                ======== test case step "Test_Sahi_landing_page" ended with OK =================
                name: Test_Sahi_landing_page
                RESULT STATE: OK
                result code: 0
                db primary key: -1
                duration: 1.373 sec.
                warning time: 10 sec.
                start time: 29-09-2017 13:41:27
                end time: 29-09-2017 13:41:29
                ======== test case step "Calculation" ended with OK =================
                name: Calculation
                RESULT STATE: OK
                result code: 0
                db primary key: -1
                duration: 13.154 sec.
                warning time: 20 sec.
                start time: 29-09-2017 13:41:29
                end time: 29-09-2017 13:41:42
                ======== test case step "Editor" ended with OK =================
                name: Editor
                RESULT STATE: OK
                result code: 0
                db primary key: -1
                duration: 2.729 sec.
                warning time: 20 sec.
                start time: 29-09-2017 13:41:42
                end time: 29-09-2017 13:41:45
===========  SAKULI Testsuite "example_xfce" execution FINISHED - OK ======================

SAKULI_RETURN_VAL: 0
In the second part of the tutorial, we will send the gathered results to a containerized OMD Labs monitoring server.
First we want to create a service configuration for the created sakuli tests. Therefore we created the file part_02/omd-nagios/ansible_dropin/xfce_checks/files/sakuli_e2e_monitoring_nagios_objects.cfg. For details see Sakuli Documentation - OMD Gearman Forwarder.
sakuli_e2e_monitoring_nagios_objects.cfg.
define service {
    name tpl_s_sakuli_xfce_template
    use tpl_s_sakuli_gearman_grafana,tpl_s_sakuli_screenshot_history
    check_command check_dummy!3!'Did not receive any Sakuli result since 15 minutes.'
    freshness_threshold 900
    register 0
    flap_detection_enabled 0
}

define service {
  service_description            example_xfce_ubuntu_firefox
  host_name                      sakuli_client
  use                            tpl_s_sakuli_xfce_template
}

define service {
  service_description            example_xfce_centos_chrome
  host_name                      sakuli_client
  use                            tpl_s_sakuli_xfce_template
}

define host {
  host_name                      sakuli_client
  alias                          Sakuli docker containers
  address                        127.0.0.1
  use                            generic-host
}
To add the above service configuration to the OMD, we will use the predefined Docker image consol/omd-labs-centos-sakuli:grafana, add the sources to the image and call the Ansible Playbook under part_02/omd-nagios/ansible_dropin/xfce_checks/. The main.yml defines, how Ansible set the timezone, copy the service configuration and configures the mod-gearman encryption password:
part_02/omd-nagios/ansible_dropin/xfce_checks/tasks/main.yml.
- name: set timezone
  shell: echo 'TZ=Europe/Berlin' >> /opt/omd/sites/demo/etc/environment
- name: Copy Nagios config file
  copy:
    src: sakuli_e2e_monitoring_nagios_objects.cfg
    dest: /opt/omd/sites/demo/etc/nagios/conf.d/
    owner: demo

- name: Copy mod-gearman config file
  copy:
    src: ""
    dest: /opt/omd/sites/demo/etc/mod-gearman/
    owner: demo
  with_fileglob:
    - mod-gearman/*
To execute the Ansible playbook at the startup, we mount the folder ansible_dropin into root/ansible_dropin at the omd container. This is done by the following [Docker Compose] file:
part_02/omd-nagios/docker-compose.yml.
omd-nagios:
    container_name: omd-nagios
    image: consol/omd-labs-centos-sakuli:grafana
    ports:
    - 8043:443
    volumes:
- ./ansible_dropin/:/root/ansible_dropinNow all should be configured correctly. So we can start the OMD server, execute
$ docker-compose -f part_02/omd-nagios/docker-compose.yml up

.....
omd-nagios    | PLAY RECAP *********************************************************************
omd-nagios    | localhost                  : ok=4    changed=3    unreachable=0    failed=0
omd-nagios    |
omd-nagios    |
omd-nagios    | omd-labs: Starting site demo...
omd-nagios    | --------------------------------------
omd-nagios    | Preparing tmp directory /omd/sites/demo/tmp...Starting gearmand...OK
omd-nagios    | Starting influxdb....OK
omd-nagios    | Starting Grafana...OK
omd-nagios    | creating datasource nagflux  OK
omd-nagios    | creating datasource _internal  OK
omd-nagios    | creating datasource sakuli  OK
omd-nagios    | Starting gearman_worker...OK
omd-nagios    | Starting nagios...OK
omd-nagios    | Starting dedicated Apache for site demo...OK
omd-nagios    | Starting Nagflux...OK
omd-nagios    | Initializing Crontab...OK
omd-nagios    | OK
omd-nagios    |
omd-nagios    | omd-labs: Starting Apache web server...
omd-nagios    | --------------------------------------
omd-nagios    | AH00558: httpd: Could not reliably determine the server's fully qualified domain name, using 192.168.199.2. Set the 'ServerName' directive globally to suppress this message
Tip
To shortcut some special docker-compose commands, you can execute the script
part_02/omd-nagios/deploy_omd.sh(ensures that containers will be removed and started from scratch)
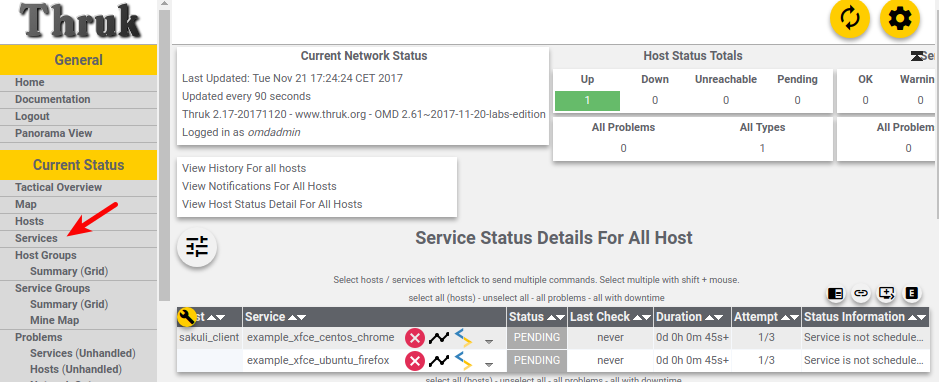
After the successful startup of the OMD we can now open the OMD Demo page and see two services example_xfce_centos_chrome and example_xfce_centos_chrome:
1) Open https://localhost:8043/demo
2) Accept the security warning about the self-signed certificate
3) Login to OMD with user omdadmin and password omd
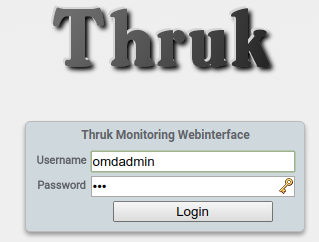
4) Click Services to get overview page
After OMD is ready to receive results from Sakuli as passive check, we need to configure the connection in our Sakuli tests to froward the test results to OMD:
1) Add the created OMD network omd-nagios as external link to the docker-compose.yml of each sakuli test definition, so Sakuli can send data to the OMD server:
part_02/sakuli-tests/docker-compose.yml.
sakuli_test_ubuntu_firefox:
  ...
  external_links:
  - omd-nagios
  command: run /opt/test/example_xfce

sakuli_test_centos_chrome:
  ...
  external_links:
  - omd-nagios
  command: run /opt/test/example_xfce -browser chrome
2) Add the following lines to the sakuli.properties file. This enables the gearman forwarder and configures the connection to the OMD server:
part_02/sakuli-tests/sakuli.properties.
# GEARMAN forwarder
sakuli.forwarder.gearman.enabled=true
sakuli.forwarder.gearman.server.host=omd-nagios
sakuli.forwarder.gearman.server.port=4730
sakuli.forwarder.gearman.nagios.hostname=sakuli_client
3) Due to the fact, that Sakuli transfer the results encrypted by default, we have also to add the encryption secret to the sakuli.properties:
### Gearman encryption
sakuli.forwarder.gearman.encryption=true
sakuli.forwarder.gearman.secret.key=pass4encrypt
Tip
For production usage it’s also possible to set the environment variable
SAKULI_FORWARDER_GEARMAN_SECRET_KEY, see Sakuli - Property loading mechanism.
Now we can test the setup und run the test like before:
docker-compose -f part_02/sakuli-tests/docker-compose.yml up
After all went good, the OMD server should now show the services as OK: 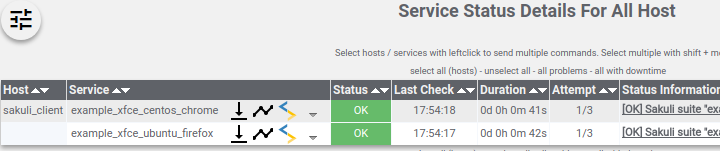
To get real monitoring runtime data we need to setup a continuous loop which executes the tests all the time and creates some graphs for us. For this execute the helper script execute_all_4_monitoring.sh
part_02/sakuli-tests/execute_all_4_monitoring.sh
Note
To stop the loop press
CTRL + C.
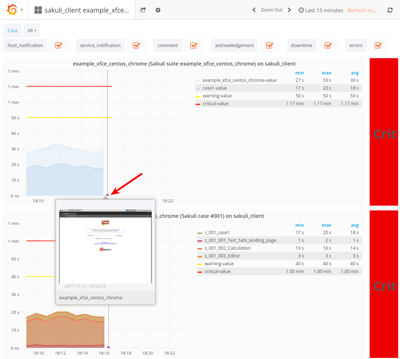
After a few runs we should be able the the some graphs. Therefore click on the Extra Action button and a Grafana dashboard should appear. 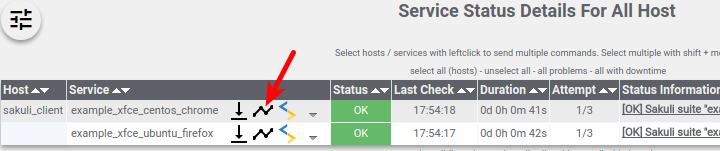 To get better view of the latest results choose
 Last 15 minutes as time interval. 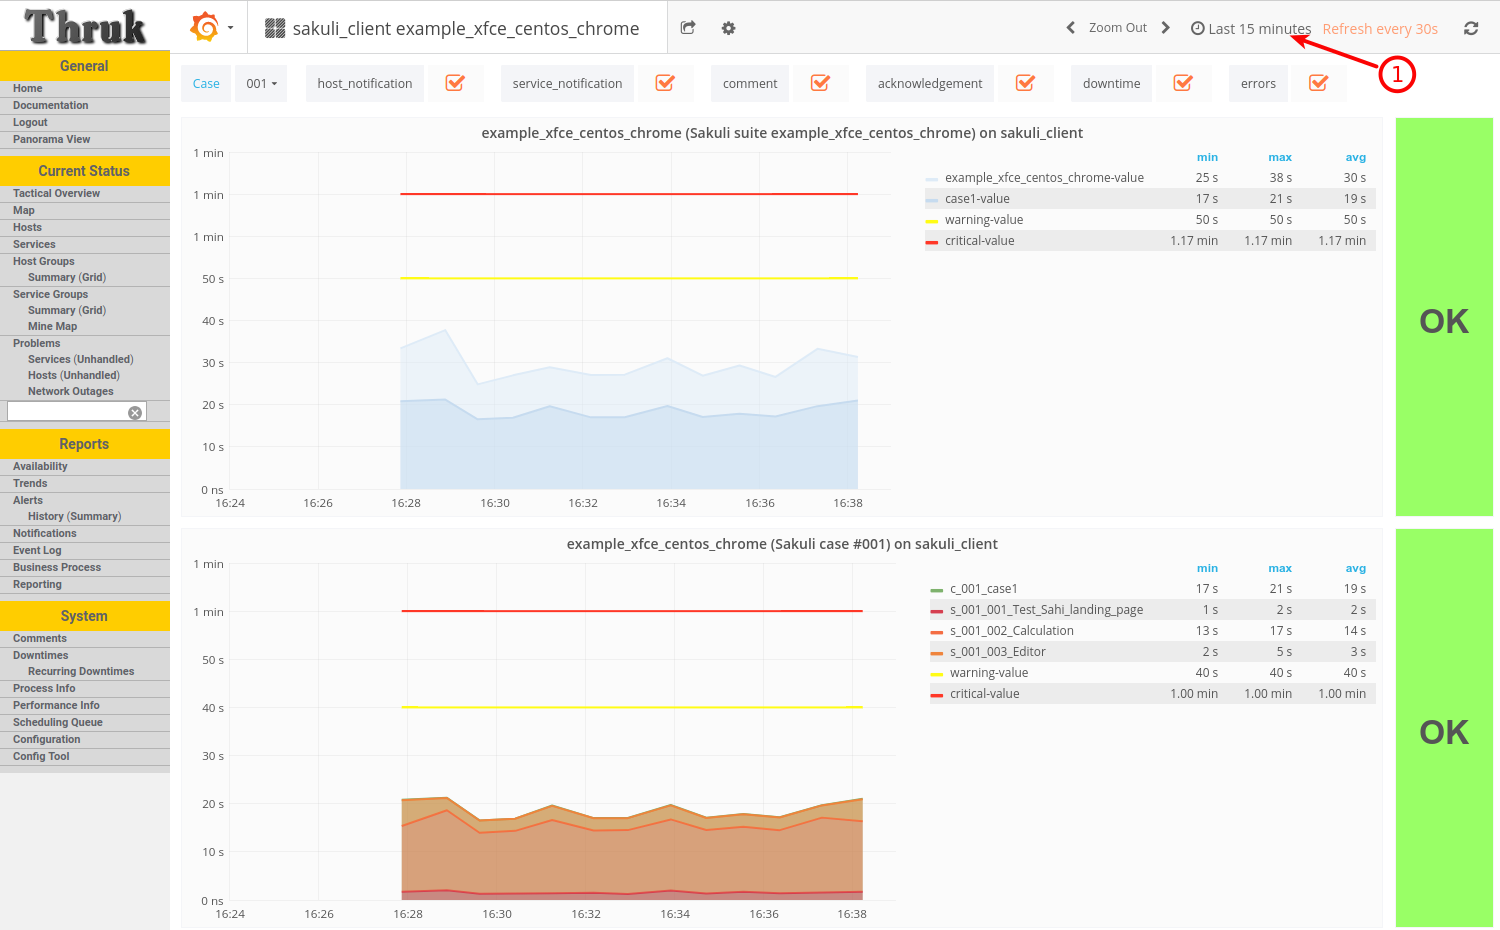
The red/yellow lines are representing the critical/warning times from the suite respectively the test case definition of Part 1. If one of the threshold is exceeded the service will change state to WARNING or CRITICAL and trigger a notification. To enable E-Mail notification, see OMD Notifications.
To get a feeling how Sakuli reacts on errors we will modify the testcase definition sakuli_demo.js to a not present link validation and force an error through this:
part_02/sakuli-tests/example_xfce/case1/sakuli_demo.js.
...
try {
    checkCentOS();
    _highlight(_link(/SSL M.*/));
    // remove:  _highlight(_link("Logs"));
    _highlight(_link("XXXX_Logs"));
    _highlight(_link("Online Documentation"));
    _highlight(_link("Test Pages"));
    ...
On the next test run in the loop the OMD sever will change the state to CRITICAL and shows the error message:
[CRIT] Sakuli suite "example_xfce_centos_chrome" (25.23s) EXCEPTION: 'CASE "case1": STEP "Test_Sahi_landing_page": _highlight(_link("XXXX_Logs")): TypeError:
To get a idea about what happens, Sakuli automatically creates a screenshot of every error and append it to the service result: 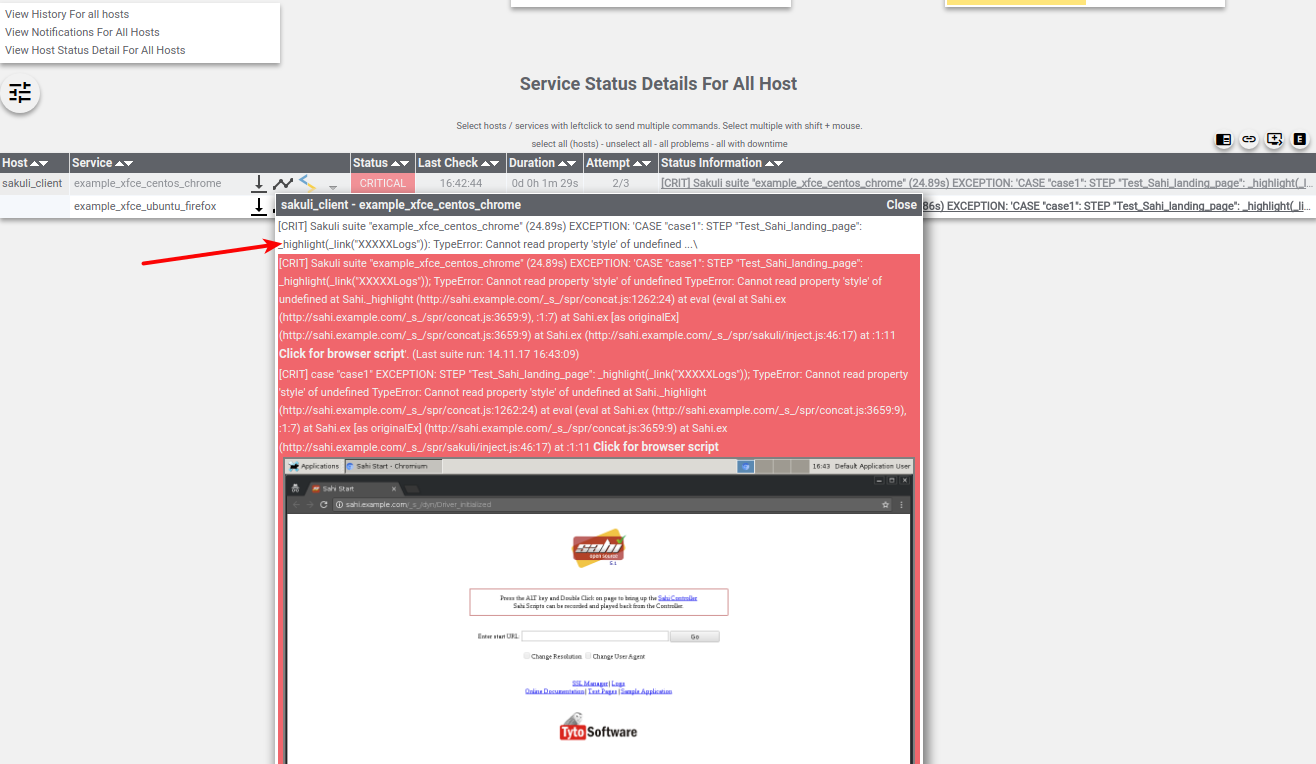
With the updated Grafana template (version 1.1.0) it is even possible to see the screenshot directly in the Grafana graph, if you hoover over the purple annotation: 
The above tutorial shows how easy it is to setup a fully functional end-to-end monitoring with Sakuli, OMD and Docker. Sometime this use case is also called “application monitoring”, but however Sakuli will no detect if an application is down, has functional errors or even have a performance issue.
After all is set up, the example test cases can now be used as template for your own e2e tests and monitoring environment. With the release 1.1.0 it’s also possible to run the whole setup in container management solutions like Kubernetes or OpenShift. To get more information about this or about how to write your own e2e tests take a look to our other Tutorials or to the official Sakuli Documentation.
If you need help or you have some further questions feel free to contact us through sakuli@consol.de or open an issue at Github: github.com/sakuli-examples/issues.