


Prometheus is a popular monitoring tool based on time series data. One of the strengths of Prometheus is its deep integration with Kubernetes. Kubernetes components provide Prometheus metrics out of the box, and Prometheus’s service discovery integrates well with dynamic deployments in Kubernetes.
There are multiple ways how to set up Prometheus in a Kubernetes cluster. There’s an official Prometheus Docker image, so you could use that and create the Kubernetes YAML files from scratch (which according to Joe Beda is not totally crazy). There is also a helm chart. And there is the Prometheus Operator, which is built on top of the CoreOS operator framework.
This blog post shows how to get the Prometheus Operator up and running in a Kubernetes cluster set up with kubeadm. We use Ansible to automate the deployment.
| Author: | Fabian Stäber |
|---|---|
| Tags: | Kubernetes, kubeadm, Prometheus |
| Categories: | kubernetes |
Kubeadm is a basic toolkit that helps you bootstrap a simple Kubernetes cluster. It is intended as a basis for higher-level deployment tools, like Ansible playbooks. A typical Kubernetes cluster set-up with kubeadm consists of a single Kubernetes master, which is the machine coordinating the cluster, and multiple Kubernetes nodes, which are the machines running the actual workload.
Dealing with node failure is simple: When a node fails, the master will detect the failure and re-schedule the workload to other nodes. To get back to the desired number of nodes, you can simply create a new node and add it to the cluster. In order to add a new node to an existing cluster, you first create a token on the master with kubeadm token create, then you use that token on the new node to join the cluster with kubeadm join.
Dealing with master failure is more complicated. Good news is: Master failure is not as bad as it sounds. The cluster and all workloads will continue running with exactly the same configuration as before the failure. Applications running in the Kubernetes cluster will still be usable. However, it will not be possible to create new deployments or to recover from node failures without the master.
This post shows how to backup and restore a Kubernetes master in a kubeadm cluster.
| Author: | Fabian Stäber |
|---|---|
| Tags: | Kubernetes, kubeadm, etcd |
| Categories: | kubernetes |
This blog post shows how to use CIFS (a.k.a. SMB, Samba, Windows Share) network filesystems as Kubernetes volumes.
Docker containers running in Kubernetes have an ephemeral file system: Once a container is terminated, all files are gone. In order to store persistent data in Kubernetes, you need to mount a Persistent Volume into your container. Kubernetes has built-in support for network filesystems found in the most common cloud providers, like Amazon’s EBS, Microsoft’s Azure disk, etc. However, some cloud hosting services, like the Hetzner cloud, provide network storage using the CIFS (SMB, Samba, Windows Share) protocol, which is not natively supported in Kubernetes.
Fortunately, Kubernetes provides Flexvolume, which is a plugin mechanism enabling users to write their own drivers. There are a few flexvolume drivers for CIFS out there, but for different reasons none of them seemed to work for me. So I wrote my own, which can be found on github.com/fstab/cifs.
This blog post shows how to use the fstab/cifs plugin for mounting CIFS volumes in Kubernetes.
| Author: | Fabian Stäber |
|---|---|
| Tags: | Kubernetes |
| Categories: | kubernetes |
![]()
ConSol CM brings BPM to a CRM system. In-house ConSol CM is used to process cases of a wide range of types. Amongst others it also maps the sales process. For that purpose a new sales case is created automatically or manually every time a sales opportunity or lead comes up. To these cases, information can be added concerning the communication with the customer, the origin of the opportunities and others.
Within a research and development project the scope was to predict the success for open sales cases, using machine learning algorithms. This way, sales employees would know already in an early stage if the opportunity most probably will be successful or how to adapt their strategy during the sales process to increase the chances for success.
| Author: | Nicole Wochatz |
|---|---|
| Tags: | consol-cm, big-data, python, machine-learning, k-means, decision-tree, random-forest |
| Categories: | consol-cm, big-data |
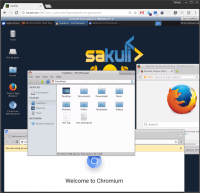
Docker Headless VNC Container 1.3.0 has been released today. The different Docker images contains a complete VNC based, headless UI environment for testautomation like Sakuli does or simply for web browsing and temporary work in a throw-away UI container. The functionality is pretty near to a VM based image, but can be started in seconds instead of minutes. Each Docker image has therefore installed the following components:
| Author: | Tobias Schneck |
|---|---|
| Tags: | docker, openshift, kubernetes, continuous integration, testautomation |
| Categories: | development |
When you are developing software, you will most likely stumble upon situations where you must perform frequent, but minor, code changes. Changes that do not alter your software’s basic functionality, changes so simple that from a developer’s perspective are more like a different configuration for your code but are still a bit too complex to use a simple configuration file.
In this article I will show you how to use Apache FreeMarker to implement dynamic and complex configurations in Java projects that can be configured from outside the application.
| Author: | Jan Lipphaus |
|---|---|
| Tags: | java, freemarker |
| Categories: | development |
Database communication is an essential part of many applications, when persistent data storage is required. May it be orders, customer data, product recommendations or product information, if persistent storage is in place, the data contains a certain business value. Therefore it’s important that your software handles your persistent storage the right way.
In this blog post you’ll learn how to test your database communication using Citrus.
| Author: | Sven Hettwer |
|---|---|
| Tags: | citrus, integration-tests, test-automation, database, jdbc |
| Categories: | development, citrus |
At this year’s FOSDEM conference I did a 30 minutes presentation on Monitoring Legacy Java Applications with Prometheus. The talk gives an overview of some of the options you have for monitoring Java applications with Prometheus when you cannot modify the application’s source code:
The video is available below.
| Author: | Fabian Stäber |
|---|---|
| Tags: | PrometheusIO, Java, FOSDEM, talk, grok_exporter, promagent |
| Categories: | monitoring |
In diesem Blogartikel wird gezeigt, wie das Monitoring-Plugin check_nwc_health auf eigene Bedürfnisse angepasst bzw. erweitert werden kann.
Ursprünglich sollte nur die Logik des Modes ha-role modifiziert werden, um den Status von Cluster-Nodes nur zu reporten, anstatt zu alarmieren. Heraus kam eine Statusanzeige im Thruk-Frontend auf Basis von Host-Macros…
| Author: | Simon Meggle |
|---|---|
| Tags: | monitoring, thruk, check_nwc_health |
| Categories: | monitoring |
There are a lot of articles that show how to monitor an OpenShift cluster (including the monitoring of Nodes and the underlying hardware) with Prometheus running in the same OpenShift cluster. This article however is based on a different scenario: You are responsible for an application on an OpenShift cluster and want to monitor just this application, but you don’t have any administrative permission on it. The reason for this can be that you are working in a big company where the operation of the OpenShift environment is outsourced or the process to introduce a new monitoring solution takes way too long or the current monitoring solution doesn’t match your requirements and so on.
In this article I’m going to show you how to setup the monitoring of a demo application in 6 easy steps. The example is built in that manner that it will be easy for you to do the same for your application. A side note: If the OpenShift cluster that you are using will be monitored in the future with a different Prometheus setup, you don’t need to start from scratch. You might need to tweak the configuration of your scraping a bit and you need to move your dashboard to a different Grafana but that should be it.
| Author: | Olaf Meyer |
|---|---|
| Tags: | openshift, prometheus, grafana |
| Categories: | development |