


Many Nagios folks use PNP4nagios to store performance data and draw graphs.
Nowadays time series databases like Influxdb are quite trendy and have their own pros and cons. But In the end
they visualize the stored metrics with Grafana which comes with a plugable
datasource api, so wouldn’t it be nice to use the already collected RRD data in Grafana as well? This
combines the speed of rrd with the more modern graphs from Grafana.
Started as a side project to PNP4Nagios there is a metrics api available which allows
us to query the used hosts, services and performance labels along with the metrics itself. Hopefully the api will be part of the
next PNP4Nagios release. Thanks Jörg for your work here.
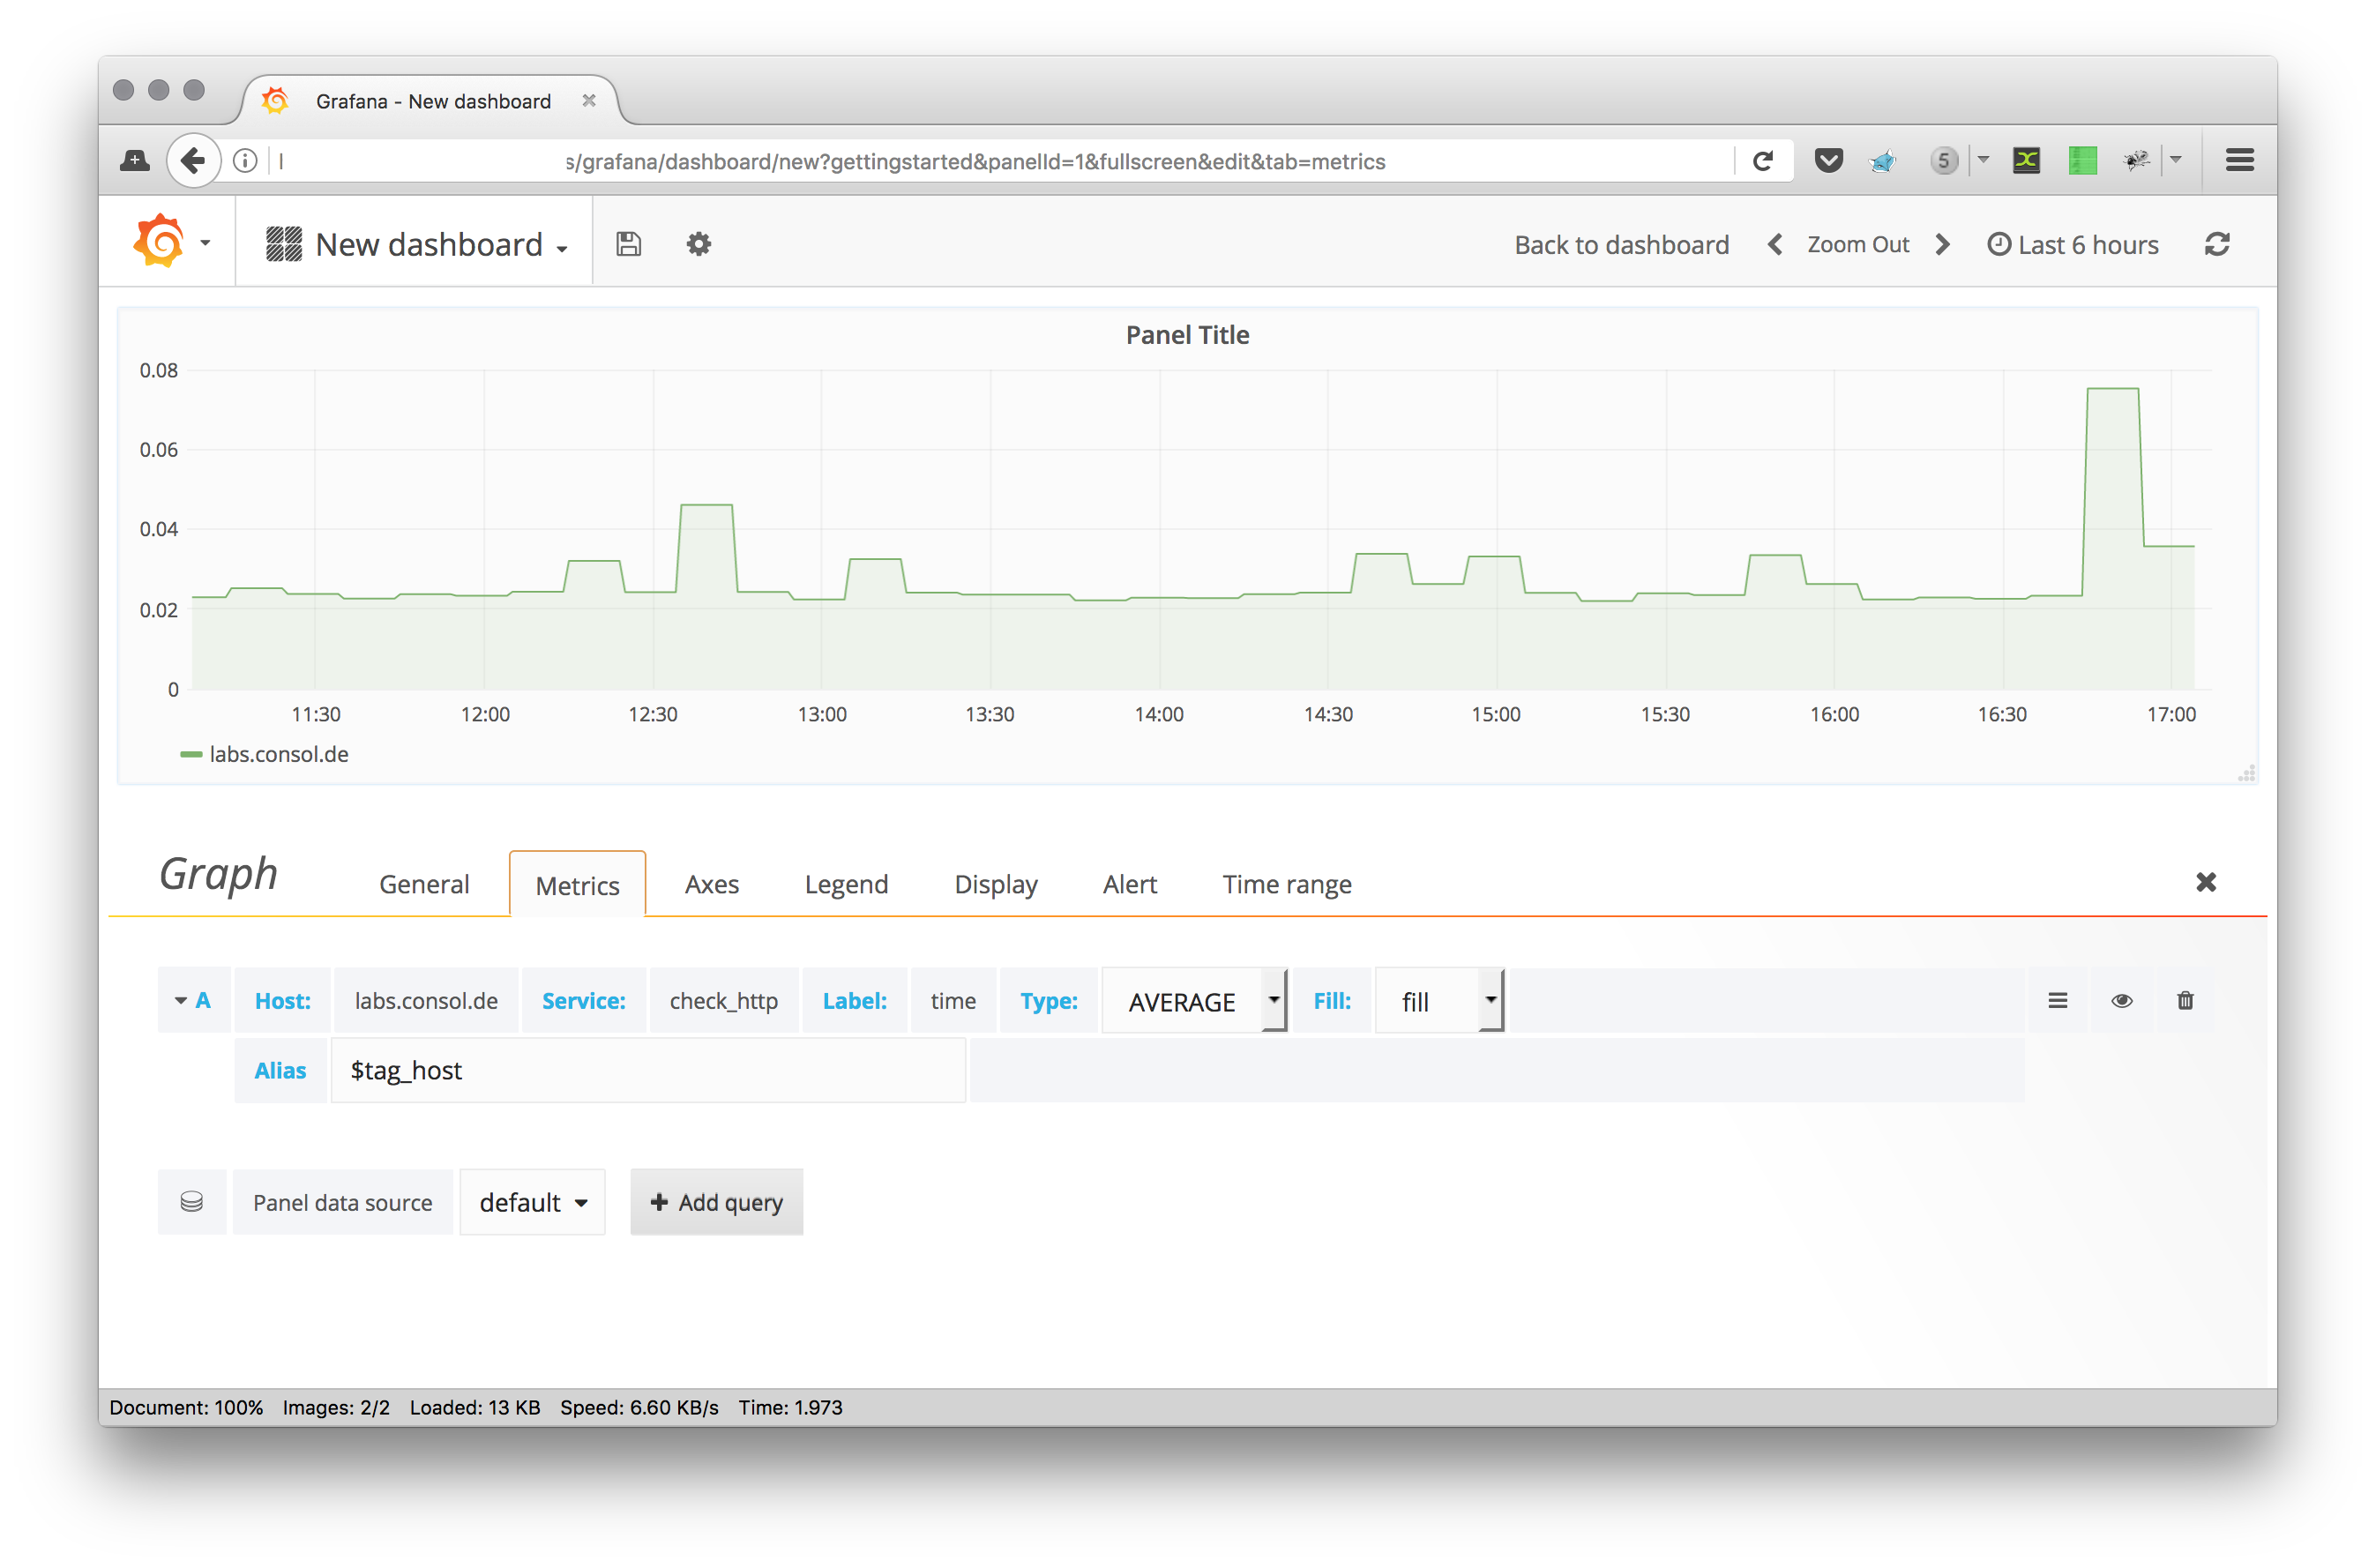
The counterpart on Grafanas side is the pnp datasource which connects grafana
to pnp and provides the query editor.
In OMD-Labs we’ve put everything together already so when you have enabled PNP4Nagios (which is the default anyway) and
enabled Grafana by:
%> omd config set GRAFANA on
A new datasource is created in Grafana and you can start right away to create some dashboards.
Note: this works with latest OMD-Labs version 2017-02-20 or later.
The query syntax is quite simple right now, but at least it offers basic regular expression support.
For example its easy to graph all ping services in a single query:
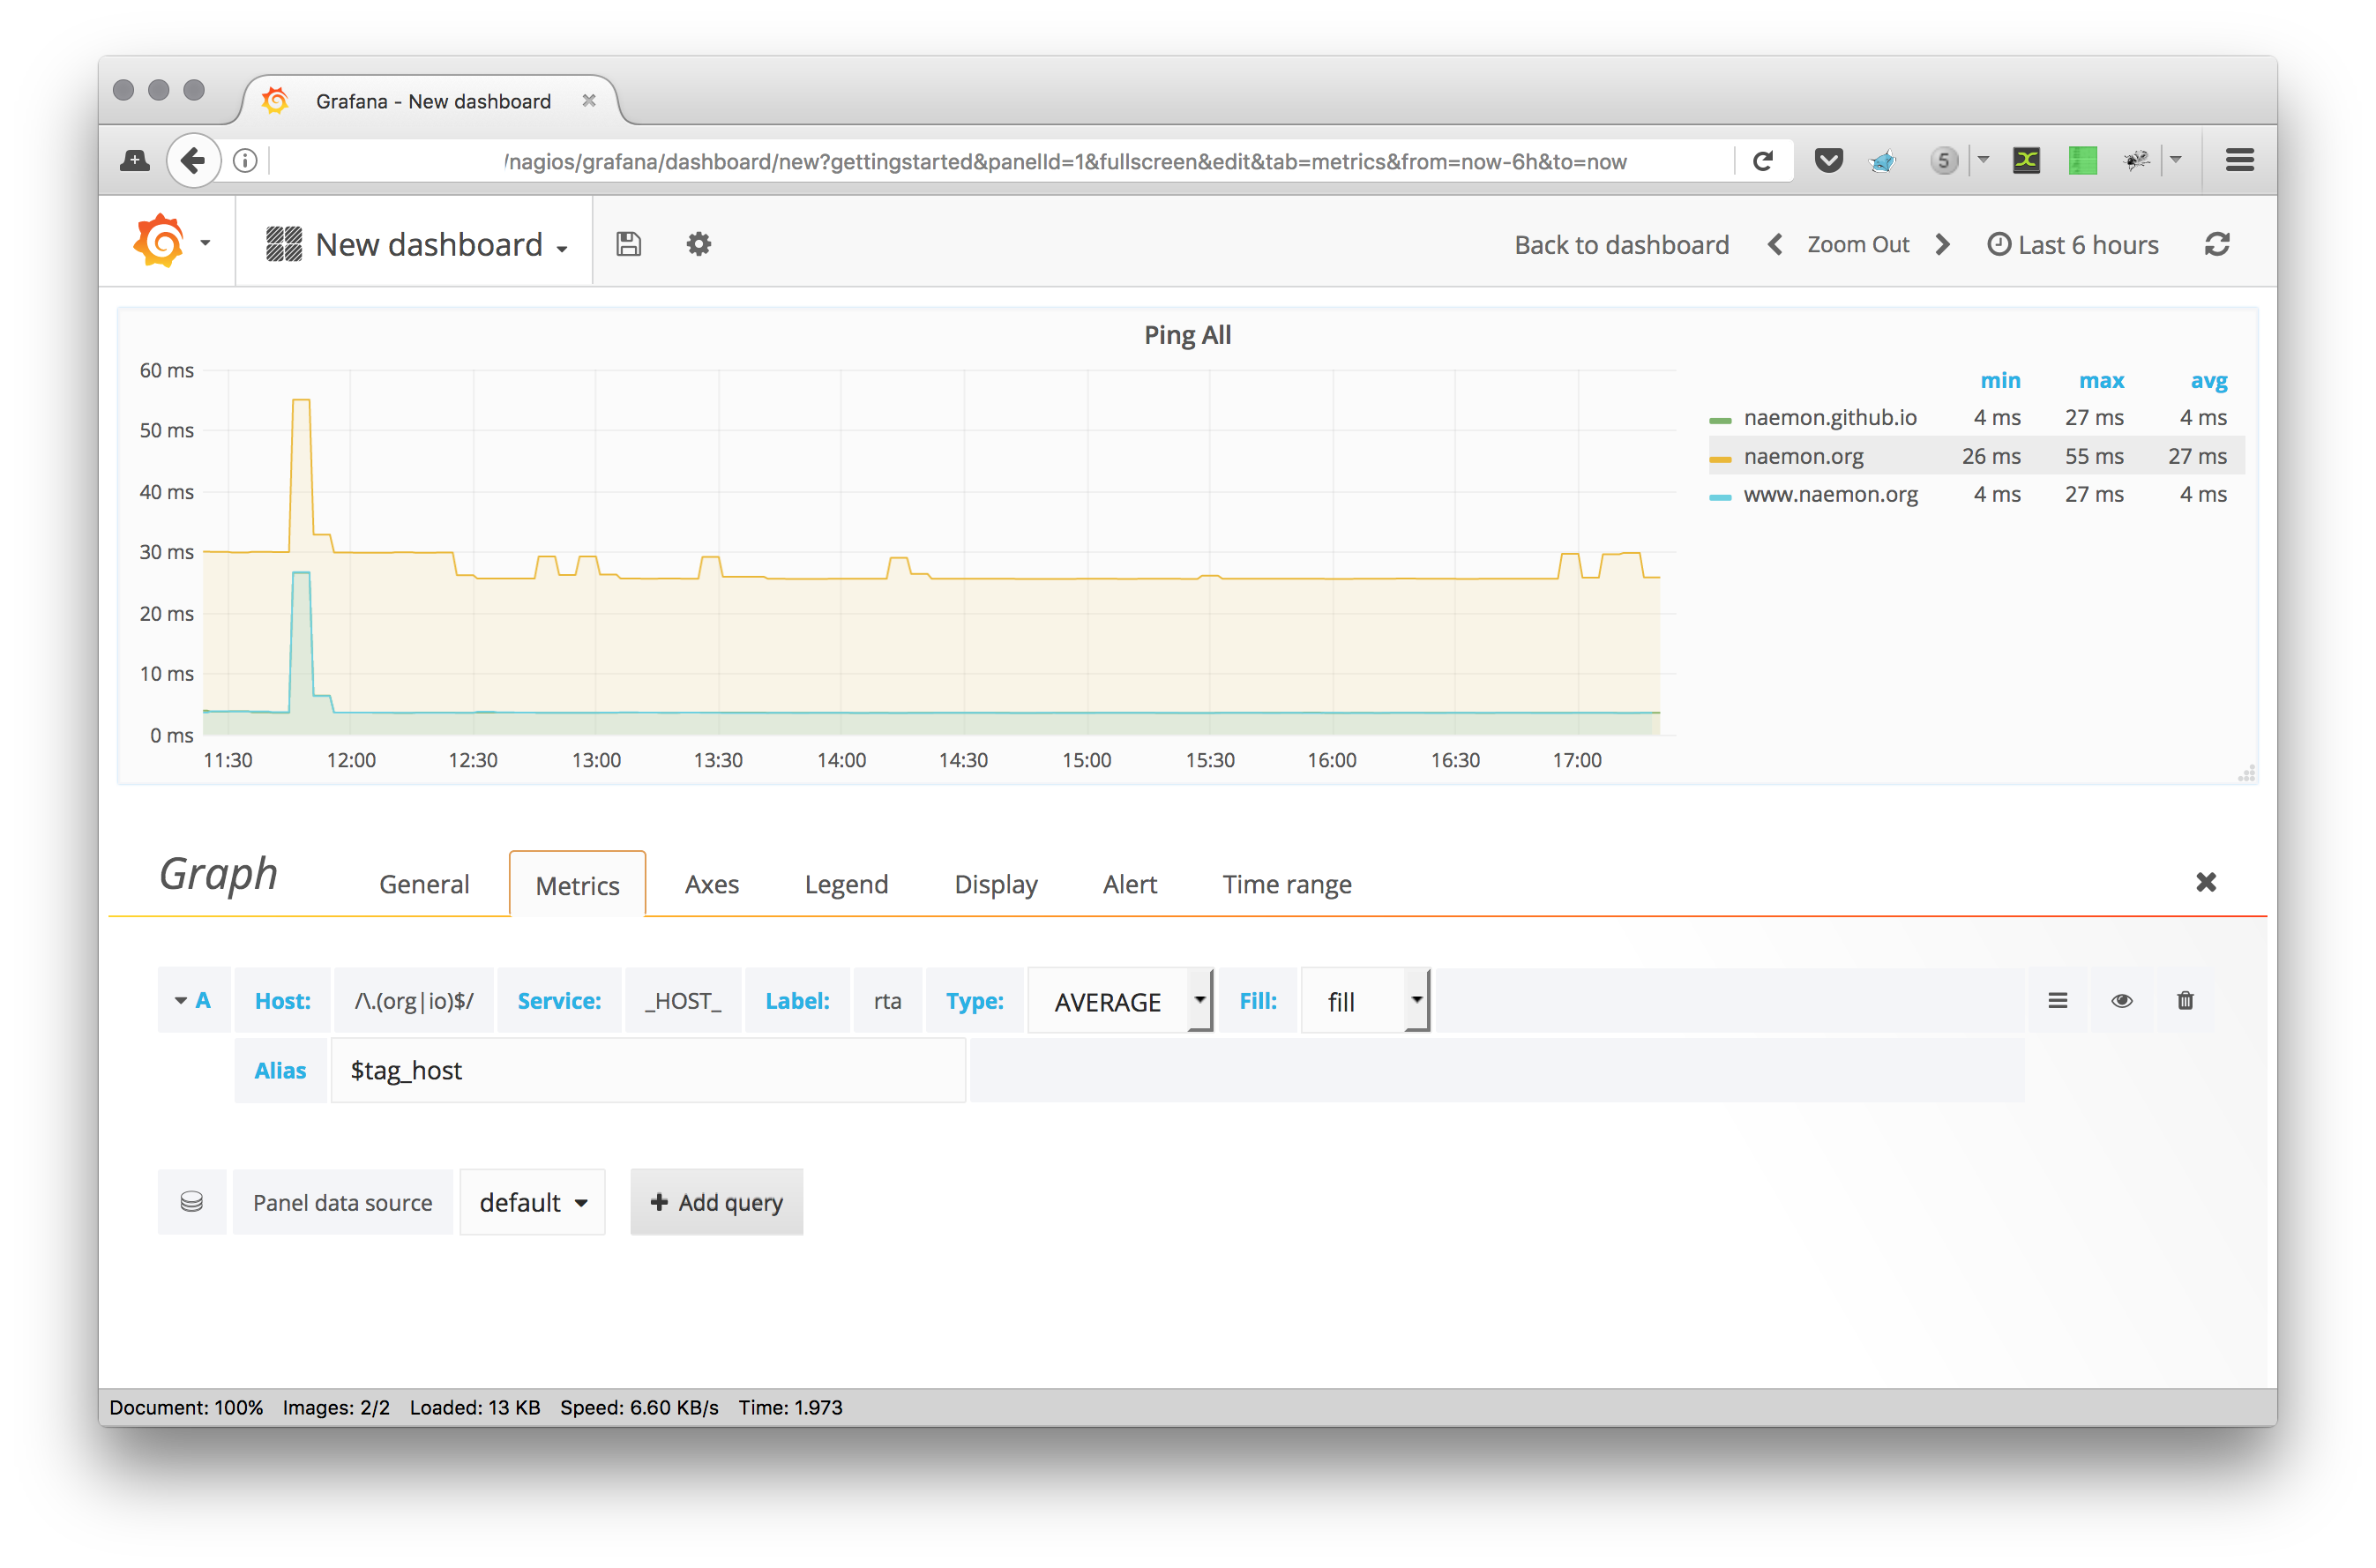
And of course you can just add multiple series into a single graph.