We often get asked about nagios server sizing, so we did some benchmarking. Here are the results.
To get proper results all tests were made on the same system:
All tests were made with a loaded livestatus module to fetch actual numbers of executed checks. The test setup was based on OMD
so it contains some best practice tuning already like using a ram disk, large installation tweaks and disabled environment macros. We created different sites for each test environment:
In order to meassure the overhead of different cores, we used several test plugins. Perl plugins were tested with and without embedded perl for cores which support EPN.
A simple c plugin:
#include <stdio.h>

int main(void) {
    printf("simple c plugin\n");
    return 0;
}
A simple shell plugin:
#!/bin/bash

echo "simple bash plugin"
exit 0
A simple perl plugin:
#!/usr/bin/perl

print "simple perl plugin\n";
exit 0;
A huge perl plugin:
#!/usr/bin/perl

use warnings;
use strict;
use Moose;
use Catalyst;

print "not so simple perl epn plugin\n";
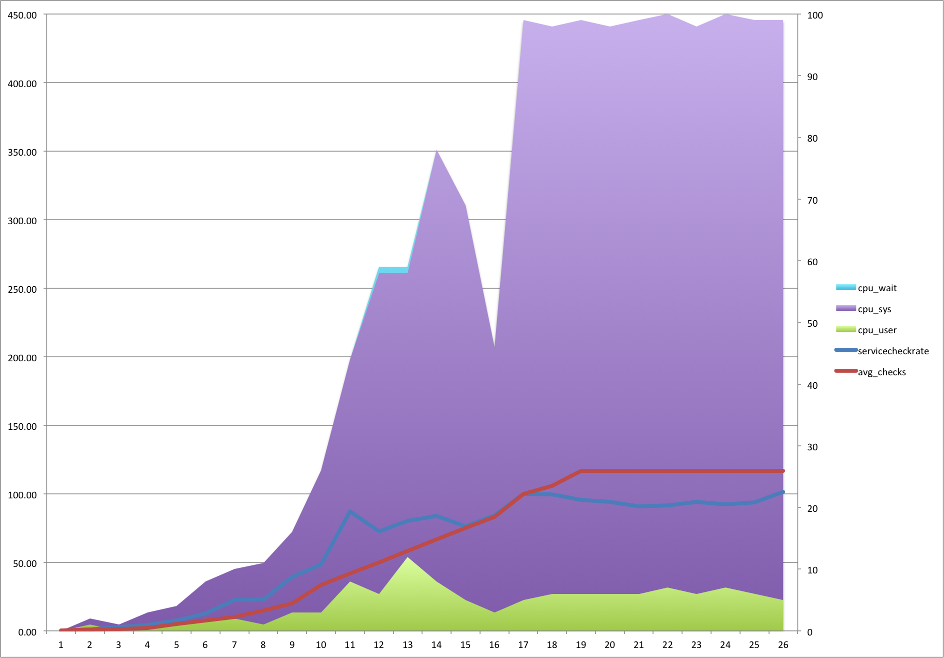
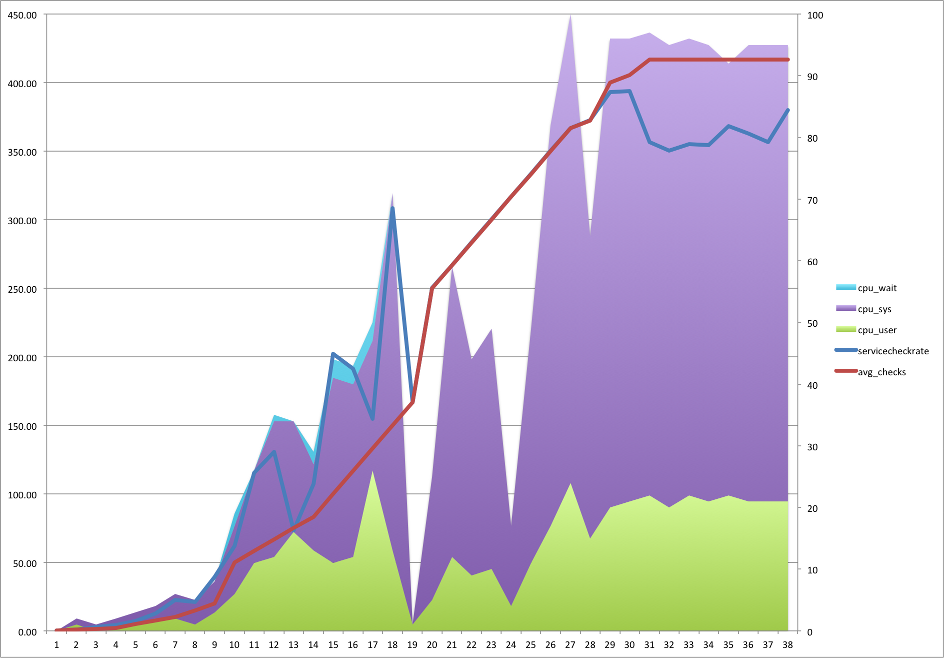
exit 0;For each benchmark the testscript started with a small number of hosts/service (1 minute interval) and increased that number as long as the latency was below 5seconds and the cpu isn’t working at maximum. Graphs werde created including the calculated average number of checks which should run per second (red line) and the actual number of checks per second (blue line).

Running the benchmark with a Nagios 3 Core tops out at around 100 Checks per second.

Using Mod-Gearman increases the upper limit to almost 400 checks per second.

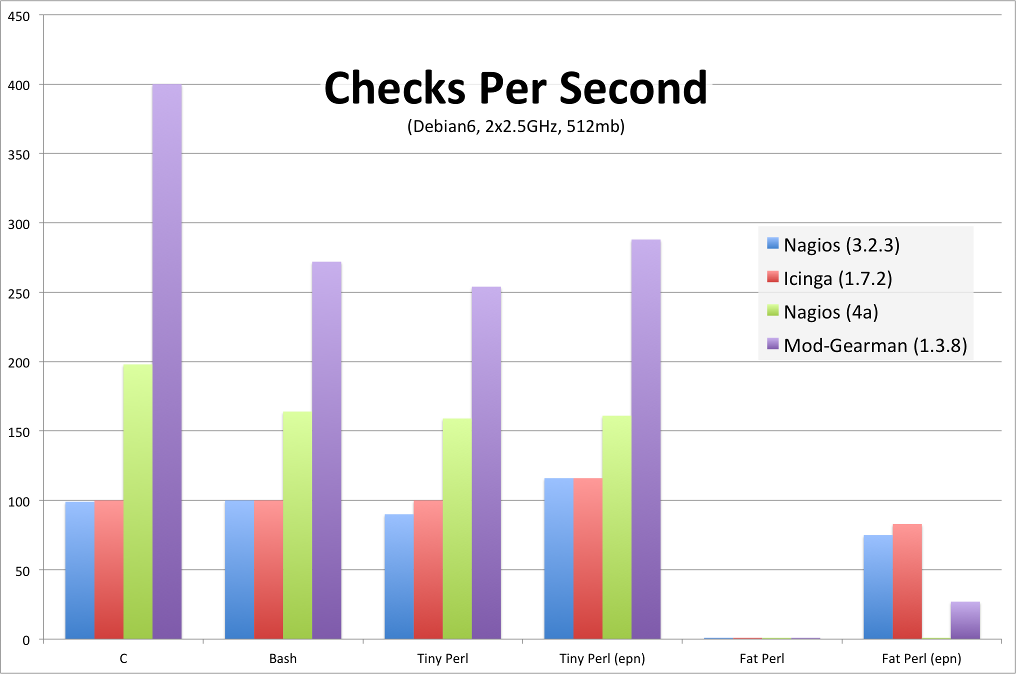
Putting all results into a single graph.
There is nearly no difference between small C, Perl or Shell plugins, but when plugins get heavier using embedded perl helps a lot. It’s faster
to run perl plugins with embedded perl than running native compiled c plugins. The huge perl check is mainly limited by the underlying disk which is
not very fast in our test lab but it shows the power of Embedded Perl.

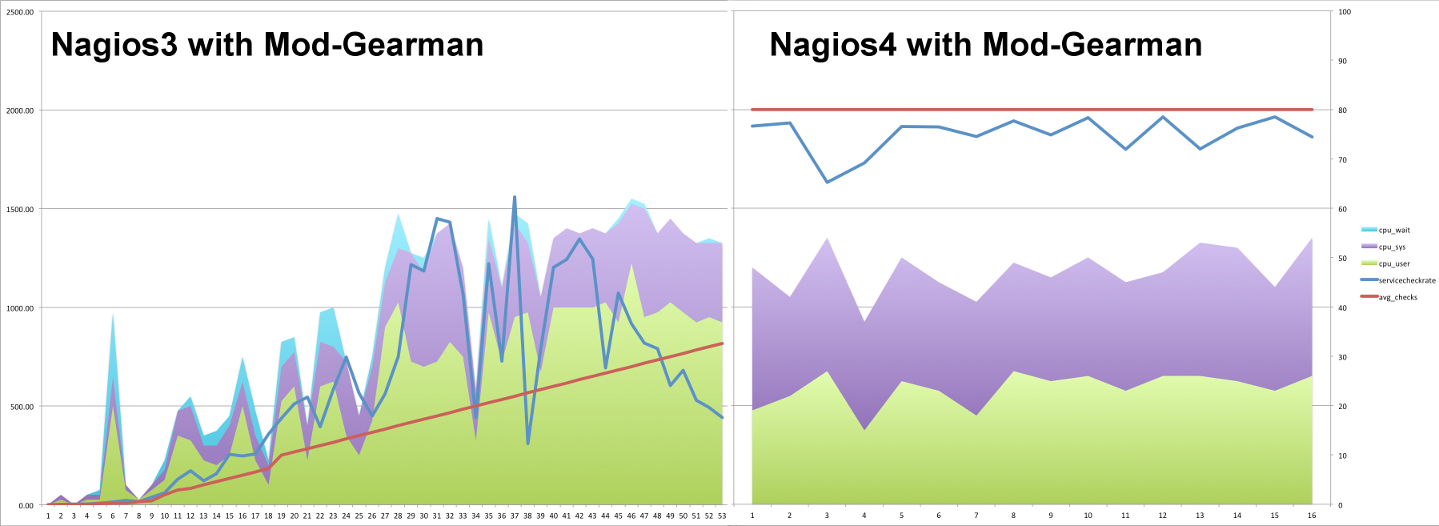
This time we used external worker to just measure how fast the Nagios Core can process result. And as we can see, Nagios 4 processes about 4x times more than Nagios 3. The checks are still active checks but executed on remote workers.
The load on your monitoring box is mainly related to what kind of plugin you run. Mod-Gearman helps a lot to reduce some overhead and spread the load over multiple hosts when one is not enough. Mod-Gearman cannot solve all performance problems, for example bad configuration or when using other plugins like ndo,
but when doing it right, you can check up to 2000 Services/Hosts per second which is equivalent to 600.000 Services at a 5 Minute interval with a single Nagios core.