check_logfiles
Posted on July 12th, 2009 by lausser
Description
check_logfiles is a Plugin for Nagios which scans log files for specific patterns.
Motivation
The conventional plugins which scan log files are not adequate in a mission critical environment. Especially the missing ability to handle logfile rotation and inclusion of the rotated archives in the scan allow gaps in the monitoring. Check_logfiles was written because these deficiencies would have prevented Nagios from replacing a propritetary monitoring system.
Features
- Detection of rotations – usually nightly logfiles are rotated and compressed. Each operating system or company has it’s own naming scheme. If this rotation is done between two runs of check_logfiles also the rotated archive has to be scanned to avoid gaps. The most common rotation schemes are predefined but you can describe any strategy (shortly: where and under which name is a logfile archived).
- More than one pattern can be defined which again can be classified as warning patterns and critical patterns.
- Triggered actions – Usually nagios plugins return just an exit code and a line of text, describing the result of the check. Sometimes, however, you want to run some code during the scan every time you got a hit. Check_logfiles lets you call scripts either after every hit or at the beginning or the end of it’s runtime.
- Exceptions – If a pattern matches, the matched line could be a very special case which should not be counted as an error. You can define exception patterns which are more specific versions of your critical/warning patterns. Such a match would then cancel an alert.
- Thresholds – You can define the number of matching lines which are necessary to activate an alert.
- Protocol – The matching lines can be written to a protocol file the name of which will be included in the plugin’s output.
- Macros – Pattern definitions and logfile names may contain macros, which are resolved at runtime.
- Performance data – The number of lines scanned and the number of warnings/criticals is output.
- Windows – The plugin works with Unix as well as with Windows (e.g. with ActiveState Perl).
Introduction
Usually you call the plugin with the –config option which gets the name of a configuration file:
nagios$ check_logfiles --config <configfile> OK - no errors or warnings
In it’s most simple form check_logfiles can get all the essential parameters as command line options. However, not all features can be utilized in this case.
nagios$ check_logfiles --tag=ssh --logfile=/var/adm/messages
--rotation=SOLARIS
--criticalpattern="Failed password for root"
OK - no errors or warnings |ssh=1722;0;0;0
nagios$ check_logfiles --tag=ssh --logfile=/var/adm/messages
--rotation=SOLARIS
--criticalpattern="Failed password for root"
CRITICAL - (1 errors in check_logfiles.protocol-2007-04-25-20-59-20)
- Apr 25 20:59:15 srvweb8 sshd[10849]:
[ID 800047 auth.info] Failed password for root
from 172.16.224.11 port 24206 ssh2 |ssh=2831;0;1;0In principle check_logfiles scans a log file until the end-of-file is reached. The offset will then be saved in a so-called seekfile. The next time check_logfiles runs, this offset will be used as the starting position inside the log file. In the event that a rotation has occurred in the meantime, the rest of the rotated archive will be scanned also.
Documentation
For the most simple applications it is sufficient to call check_logfile with command line parameters. More complex scan jobs can be described with a config file.
Command line options
- –tag=<identifier> A short unique descriptor for this search. It will appear in the output of the plugin and is used to separare the different services.
- –logfile=<filenname> This is the name of the log file you want to scan.
- –rotation=<method> This is the method how log files are rotated.
- –criticalpattern=<regexp> A regular expression which will trigger a critical error.
- –warningpattern=<regexp> The same…a match results in a warning.
- –criticalexception=<regexp> / –warningexception=<regexp> Exceptions which are not counted as errors.
- –okpattern=<regexp> A pattern which resets the error counters.
- –noprotocol Normally all the matched lines are written into a protocol file with this file’s name appearing in the plugin’s output. This option switches this off.
- –syslogserver With this option you limit the pattern matching to lines originating from the host check_logfiles is running on.
- –syslogclient=<clientname> With this option you limit the pattern matching to lines originating from the host named in this option.
- –sticky[=<lifetime>] Errors are propagated through successive runs.
- –config The name of a configuration file. The syntax of this file is described in the next section.
- –configdir The name of a configuration directory. Configfiles ending in .cfg or .conf are (recursively) imported.
- –searches=<tag1,tag2,…> A list of tags of those searches which are to be run. Using this parameter, not all searches listed in the config file are run, but only those selected. (–selectedsearches is also possible)
- –report=[short|long|html]This option turns on multiline output (Default: off). The setting html generates a table which display the last hits in the service details view.
- –maxlength=[length] With this parameter long lines are truncated (Default: off). Some programs (e.g. TrueScan) generate entries in the eventlog of such a length, that the output of the plugin becomes longer than 1024 characters. NSClient++ discards these.
- –winwarncrit With this parameter messages in the eventlog are classified by the type WARNING/ERROR (Default: off). Replaces or complements warning/criticalpattern.
Format of the configuration file
The definitions in this file are written with Perl-syntax. There is a distinction between global variables which influence check_logfiles as a whole and variables which are related to the single searches. A “search” combines where to search, what to search for, which weight a hit has, which action will be triggered in case of a hit, and so on…
| $seekfilesdir | A directory where files with status information will be saved after a run of check_logfiles. This status information helps check_logfiles to remember up to which position the log file has been scanned during the last run. This way only newly written lines of log files will be read. | The default is /tmp or the directory which has been specified with the –with-seekfiles-dir of ./configure. |
| $protocolsdir | A directory where check_logfiles writes protocol files with the matched lines. | The default is /tmp or the directory which has been specified with the –with-protocol-dir of ./configure. |
| $protocolretention | The lifetime of protocol files in days. After these days the files are deleted automatically | The default is 7 days. |
| $scriptpath | A list of directories where the triggered scripts can be found.(Separated by : under Unix and ; under Windows) | The default is /bin:/usr/bin:/sbin:/usr/sbin or the directories which has been specified with the –with-trusted-path of ./configure. |
| $MACROS | A hash with user-defined macro definitions. | see below. |
| $prescript | An external script which will be executed during the startup of check_logfiles. The macro $CL_TAG gets the value “startup”. $prescriptparams, $prescriptstdin and $prescriptdelay may be used like scriptparams, scriptstdin and scriptdelay. | |
| $postscript | An external script which will be executed before the termination of check_logfiles. The macro $CL_TAG$ gets the value “summary”. $postscriptparams, $postscriptstdin and $postscriptdelay may be used like scriptparams, scriptstdin and scriptdelay. | |
| $options | A list of options which control the influence of pre- and postscript. Known options are smartpostscript, supersmartpostscript, smartprescript and supersmartprescript. With the option report=”short|long|html” you can customize the plugin’s output. With report=long/html, the plugin’s output can possibly become very long. By default it will be truncated to 4096 characters (The amount of data an unpatched Nagios is able to process). The option maxlength can be used to raise this limit, e.g. maxlength=8192. The option seekfileerror defines the errorlevel, if a seekfile cannot be written, e.g. seekfileerror=unknown (default:critical) | |
| @searches | An array whose elements (hash references) describe the actual work of check_logfiles. The keys for these hash references can be found in the next table. |
The single searches are further specified by the following parameters:
| tag | A unique identifier. |
| logfile | The name of the log file to scan. |
| archivedir | The name of the directory where archives will be moved to after a log file rotation. The default is the directory where the logfile resides. |
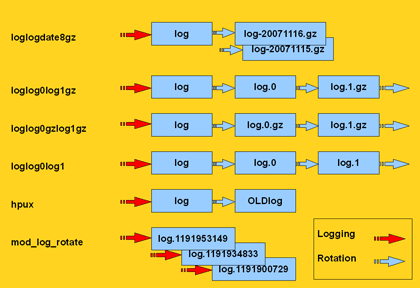
| rotation | One of the predefined methods or a regular expression, which helps identify the rotated archives. If this key is missing, check_logfiles assumes that the log file will be simply overwritten instead of rotated.![]() |
| type | One of “rotating” (default if rotation was given), “simple” (default if no rotation was given), “virtual” (for files which will strictly be scanned from the beginning), “errpt” (if instead of a logfile the output of the AIX errpt command should be scanned), “ipmitool” (if the IPMI System Event Log should be scanned), “oraclealertlog” (if the alertlog of an Oracle database should be scanned through a database connection) or “eventlog” if the windows Eventlog should be scanned. |
| criticalpatterns | A regular expression or a reference to an array of such expressions. If one of these expressions matches a line in the logfile, this is considered a critical error. If the expression begins with a “!”, then the meaning is reversed. It counts as a critical error if no match for this pattern is found. |
| criticalexceptions | One or more regular expressions which invalidate a preceding match of criticalpatterns. |
| warningpatterns | Corrensponds to criticalpatterns, except a warning instead of a critical error is created. |
| warningexceptions | see above |
| okpatterns | A regular expression or a reference to an array of such expressions. If one of these expressions matches a line in the logfile, all previous found warnings and criticals are discarded. |
| script | If a pattern matches, this script will be executed. It must reside under one of the directories specified in $scriptpath. The script gets plenty of information about the hit via environment variables. |
| scriptparams | Yo can provide command line parameters for the script here. They may contain macros. If $script is a code reference, $scriptparams must be a pointer to an array. |
| scriptstdin | If the script expects input through stdin, you can describe it here. The string may also contain macros. |
| scriptdelay | After the script has finished, check_logfiles may sleep for <delay> seconds before continuing it’s work. |
| options | This is a string with a comma-separated list of options which let you fine-tune the search. Each option can be switched off be preceeding it’s name with “no”. The options in detail are explained in the next table: |
| template | Instead of a tag , a search can also be identified by a template name. If you call check_logfiles with the –tag option, the according search will be run as if it was defined with a tagname. See examples. |
Options
| [no]script | Controls whether a script can be executed. | default: off |
| [no]smartscript | Controls whether exitcode and output of the script shall be treated like an additional match. | default: off |
| [no]supersmartscript | Controls whether exitcode and output of the script should replace the triggering match. | default: off |
| [no]protocol | Controls whether the matching lines are written to a protocol file for later investigation. | default: on |
| [no]count | Controls whether hits are counted and decide over the final exit code. If not you can use check_logfiles also just to execute the triggered scripts. | default: on |
| [no]syslogserver | If set, only lines originating from the local host are taken into account. This is important if check_logfiles runs on a syslog server where many other hosts report their events to. | default: off |
| [no]syslogclient=string | A prefilter. Only lines matching the string are further examined. | |
| [no]perfdata | Controls whether performance data should be added to the output. | default: on |
| [no]logfilenocry | Controls how to react, if the log file does not exist. By default this is a reason for an UNKNOWN error. If nologfilenocry is set, the missing log file will be acquiesced. | default: on |
| [no]case | Controls whether regular expressions are case-sensitive | default: on |
| [no]sticky[=seconds] | Controls whether an error is propagated through successive runs of check_logfiles. Once an error was found, the exitcode will be non-zero until an okpattern resets it or until the error expires after <second> seconds. Do not use this option until you know exactly what you do. | default: off |
| [no]savethresholdcount | Controls whether the hit counter will be saved between the runs. If yes, hit numbers are added until a threshold is reached (criticalthreshold). Otherwise the run begins with resetted counters. | default: on |
| [no]encoding=string | The logfile is encoded in Unicode. (e.g. ucs-2) | default: off |
| [no]maxlength=number | Truncates very long lines at the <number>-th character | default: off |
| [no]winwarncrit | Can be used instead of patterns to find all events of type WARNING/ERROR in the Windows-Eventlog | default: off |
| [no]criticalthreshold=number | A number which denotes how many lines have to match a pattern until they are considered a critical error. | default: off |
| [no]warningthreshold=number | A number which denotes how many lines have to match a pattern until they are considered a warning. | default: off |
| [no]allyoucaneat | With this option check_logfiles scans the entire logfile during the initial run (when no seekfile exists) | default: off |
| [no]eventlogformat | This option allows you to rewrite the message text of a Windows event. Normally it only consists of the field Message. You can enrich this string with additional information (EventID, Source,….)
Scroll down for details. |
default: off |
| [no]preferredlevel | If warningpattern and criticalpattern were chosen in a way that a specific line matches both of them (so the output looks like “1 error, 1 warning”), you can use this option to count only one of them. (e.g. with preferredlevel=critical the output would be “1 error”). | default: off |
| [no]randominode | This is used for a very special case, where the inode of the logfile is constantly changing. (for example because with every appended line the logfile is written entirely new) | default: off |
Predefined macros
| $CL_USERNAME | The name of the user executing check_logfiles |
| $CL_HOSTNAME$ | The hostname without domain |
| $CL_DOMAIN$ | The DNS-domain |
| $CL_FQDN$ | Both together |
| $CL_IPADDRESS$ | The IP-adress |
| $CL_DATE_YYYY$ | The current year |
| $CL_DATE_MM$ | The current month (1..12) |
| $CL_DATE_DD$ | The day of the month |
| $CL_DATE_HH$ | The current hour (0..23) |
| $CL_DATE_MI$ | The current minute |
| $CL_DATE_SS$ | The current second |
| $CL_DATE_CW$ | The current calendar week (ISO 8601:1988) |
| $CL_SERVICEDESC$ | The name of the config file without extension. |
| $CL_NSCA_SERVICEDESC$ | the same |
| $CL_NSCA_HOST_ADDRESS$ | The local address 127.0.0.1 |
| $CL_NSCA_PORT$ | 5667 |
| $CL_NSCA_TO_SEC$ | 10 |
| $CL_NSCA_CONFIG_FILE$ | send_nsca.cfg |
| The following macros change their value during the runtime. | |
| $CL_TAG$ | The tag of the current search ($CL_tag$ is the tag in minor letters) |
| $CL_TEMPLATE$ | The name of the template used (if any). |
| $CL_LOGFILE$ | The file to be scanned next |
| $CL_SERVICEOUTPUT$ | The last matched line. |
| $CL_SERVICESTATEID$ | The error level as a number 0..3 |
| $CL_SERVICESTATE$ | The error level as a word (OK, WARNING, CRITICAL, UNKNOWN) |
| $CL_SERVICEPERFDATA$ | The Performancedata. |
| $CL_PROTOCOLFILE$ | The file where all matching lines are written. |
These macros are also available in scripts called out of check_logfiles. Their values are stored in environment variables, whose names are derived from the macro’s names. The preceding CL_ is replaced by CHECK_LOGFILES_. You can also access user defined macros. Their names are also prefixed with CHECK_LOGFILES_.
nagios$ cat check_logfiles.cfg
$scriptpath = '/usr/bin/my_application/bin:/usr/local/nagios/contrib';
$MACROS = {
MY_FUNNY_MACRO => 'hihihihohoho',
MY_VOLUME => 'loud'
};
@searches = (
{
tag => 'fun',
logfile => '/var/adm/messages',
criticalpatterns => 'a funny pattern',
script => 'laugh.sh',
scriptparams => '$MY_VOLUME$',
options => 'noprotocol,script,perfdata'
},
);
nagios$ cat /usr/bin/my_application/bin/laugh.sh
#! /bin/sh
if [ -n "$1" ]; then
VOLUME=$1
fi
printf 'It is %d:%d and my status is %s\n' \
$CHECK_LOGFILES_DATE_HH \
$CHECK_LOGFILES_DATE_MI \
$CHECK_LOGFILES_SERVICESTATE
printf "I found something funny: %s\n" "$CHECK_LOGFILES_SERVICEOUTPUT"
if [ "X$VOLUME" == "Xloud" ]; then
echo "$CHECK_LOGFILES_MY_FUNNY_MACRO" | tr 'a-z' 'A-Z'
else
echo "$CHECK_LOGFILES_MY_FUNNY_MACRO"
fi
printf "Thank you, %s. You made me laugh.\n" "$CHECK_LOGFILES_USERNAME"Performance data
The number of scanned lines as well as the number of pattern matches (critical, warning and unknown) are appended to the plugin’s output in performance data format. You can suppress this by using the noperfdata option.
nagios$ check_logfiles --logfile=/var/adm/messages
--criticalpattern="Failed password" --tag=ssh
CRITICAL - (4 errors) - May 9 11:33:12 localhost sshd[29742]
Failed password for invalid user8 ... |ssh_lines27
ssh_warnings=0 ssh_criticals=4 ssh_unknowns=0
nagios$ check_logfiles --logfile=/var/adm/messages
--criticalpattern="Failed password" --tag=ssh --noperfdata
CRITICAL - (2 errors) - May 9 11:58:48 localhost sshd[29813]
Failed password for invalid user8 ...Scripts
It is possible to execute external scripts out of check_logfiles. This can be at the startup phase ($prescript), before termination ($postscript) or every time a pattern matches a line. See example above. With the option “smartscript” output and exitcode of the script are treated like a match in the logfile and reflected in the overall result. The option “supersmartscript” makes output and exitcode of the script replace those of the triggering match. Pre- and Postscript declared as supersmart scripts directly influence the process of check_logfiles. The option “supersmartprescript” causes an immediate abort of check_logfiles if the prescript has a non-zero exit code. In this case output and exitcode of check_logfiles correspond to those of the prescript. With the option “supersmartpostscript” output and exitcode of check_logfiles can be determined by the postscript. Thus a more meaningful output is possible.
Using check_logfiles with Nagios
If you have just one service which uses check_logfiles you can hard-code the config file in your services.cfg/nrpe.cfg
define service {
service_description check_sanlogs
host_name oaschgeign.muc
check_command check_nrpe!check_logfiles
is_volatile 1
check_period 7x24
max_check_attempts 1
...
}
define command {
command_name check_nrpe
command_line $USER1$/check_nrpe -H $HOSTADDRESS$ -c $ARG1$
}
command[check_logfiles]=/opt/nagios/libexec/check_logfiles
--config logdefs.cfgIf multiple services are based on check_logfiles you need multiple config files. I propose to name them after the service_description. In the following example we would have a directory cfg.d with config files solaris_check_sanlogs and solaris_check_apachelogs.
define service {
service_description logfilescan
register 0
is_volatile 1
check_period 7x24
max_check_attempts 1
...
}
define service {
service_description solaris_check_sanlogs
host_name oaschgeign.muc
check_command
check_nrpe_arg!20!check_logfiles!cfg.d/$SERVICEDESC$
contact_group sanadmin
use logfilescan
}
define service {
service_description solaris_check_apachelogs
host_name oaschgeign.muc
check_command
check_nrpe_arg!20!check_logfiles!cfg.d/$SERVICEDESC$
contact_group webadmin
use logfilescan
}
define command {
command_name check_nrpe_arg
command_line $USER1$/check_nrpe
-H $HOSTADDRESS$ -t $ARG1$ -c $ARG2$ -a $ARG3$
}
# nrpe.cfg von Host
[check_logfiles]=/opt/nagios/libexec/check_logfiles --config $ARG1$The corresponding line in the host’s nrpe.cfg looks like that:
[check_logfiles]=/opt/nagios/libexec/check_logfiles --config $ARG1$
If you use nsclient++ under Windows, the entry in the NSC.ini looks like that:
check_logfiles=C:\Perl\bin\perl C:\libexec\check_logfiles --config $ARG1$
Installation
- After unpacking the tar-archive you have to call ./configure. With ./configure –help you can show the options if you want to modify the default settings. However, these settings can later be overridden again by variables in the config file.
- Linux systems are more restrictive regarding the permission of log files. The /var/log/messages file is not readable for non-root users. If you run check_logfiles as an unprivileged user, follow the link below and look for a trick in the examples.
- –prefix=BASEDIRECTORY Specify here the directory where you want to install check_logfiles. (default: /usr/local/nagios)
- –with-nagios-user=SOMEUSER The user which will own the check_logfiles script. (default: nagios)
- –with-nagios-group=SOMEGROUP The group (default: nagios)
- –with-perl=PATH_TO_PERL The path to your perl binary. (default: The perl in the current PATH)
- –with-gzip=PATH_TO_GZIP The path to your gzip binary. (default: The gzip in the current PATH)
- –with-trusted-path=PATH_YOU_TRUST The path where you expect your triggered scripts. (default: /sbin:/usr/sbin:/bin:/usr/bin)
- –with-seekfiles-dir=SEEKFILES_DIR The directory where status files will be kept. (default: /tmp)
- –with-protocols-dir=PROTOCOLS_DIR The directory where protocol files will be written to. (default: /tmp)
- Under Windows you build the plugin with perl winconfig.pl. This will result in plugins-scripts/check_logfiles.
- The file README.exe contains instructions how to build a Windows ninary check_logfiles.exe.
Scanning of an Oracle-Alertlog with the operating mode “oraclealertlog”
If you want to scan the alert log of an oracle database without having access to the database server on the operating system level (e.g. it is a Windows server or you are not allowed to log in to a Unix server for security reasons) and therefore no access to the alert file, then this file can be mapped to a database table. The contents of the file are then visible through a database connection by executing SQL SELECT statements. If you specify the type “oraclealertlog” in a check_logfiles configuration, this method is used to scan the alert log. You need some extra parameters in the configuration.
# extra parameters in the configuration file
@searches = ({
tag => 'oratest',
type => 'oraclealertlog',
oraclealertlog => {
connect => 'db0815', # connect identifier
username => 'nagios', # database user
password => 'hirnbrand', # database password
},
criticalpatterns => [
...Preparations on the part of the database administrator
Maping external files to database tables is possible since Version 9. Use this script to prepare your database.
Preparations on the part of the Nagios administrator
Installation of the Perl-Modules DBI and DBD::Oracle (http://search.cpan.org/~pythian/DBD-Oracle-1.21/Oracle.pm).
Scanning the Windows EventLog with the operating mode “eventlog”
The eventlog of Windows systems can be processed by check_logfiles like any other logfile. Each event is treated like a line. Also only those events get analyzed which appeared since the last run of check_logfiles.
In it’s most simple form an eventlog search looks like this:
@searches = ({ tag => 'evt_sys', type => 'eventlog', criticalpatterns => ['error', 'fatal', 'failed', .... # logfile is not necessary. It doesn't make sense here.
If the evaluation of events should not be based on patterns, but the windows-internal stati WARNING and ERROR, use the option winwarncrit.
@searches = ({ tag => 'evt_sys', type => 'eventlog', options => 'winwarncrit',
It is also possible to analyze only a subset of all the events in the eventlog. You can use include- and exclude-filters for that.
@searches = ({ tag => 'winupdate', type => 'eventlog', eventlog => { eventlog => 'system', include => { source => 'Windows Update Agent', eventtype => 'error,warning', }, exclude => { eventid => '15,16', }, }, criticalpatterns => '.*',
With these settings, only those events are fetched from the eventlog which comply with the following requirements:
- The System-Eventlog is used
- Only events with the source “Windows Update Agent” are read.
- Only errors and warnings are read.
- Events with the IDs 15 and 16 are discarded.
Please be aware that the single include-requirements are combined by logical AND and the exclude-requirements are combined by logical OR. The comma-separated lists are always combined by OR.
filter = ((source == "Windows Update Agent") AND ((eventtype == "error") OR (eventtype == "warning")))
AND NOT ((eventid == 15) OR (eventid == 16))
Yo can change this behavior with the key “operation”. It takes the arguments “and” or “or”.
@searches = ({ tag => 'winupdate', type => 'eventlog', eventlog => { eventlog => 'system', include => { source => 'Windows Update Agent', eventtype => 'error,warning', operation => 'or', }, exclude => { eventid => '15,16', }, }, criticalpatterns => '.*',
Now the filter means: “Windows Update Agent” OR (“error” OR “warning”)
type => 'eventlog', eventlog => { eventlog => 'system', # system (default), application, security include => { source => 'Windows Update Agent', # The source of the event eventtype => 'error,warning', # error, warning, info, success, auditsuccess, auditfailure operation => 'or' # The logical operation. Default is "and" }, exclude => { eventid => '15,16', # The ID of the event }, },
Filters can also be used in commandline-mode.
check_logfiles --type "eventlog:eventlog=application,include,source=Windows Update Agent,eventtype=error,eventtype=warning,exclude,eventid=15,eventid=16"
With another option it is possible to rewrite an event’s message text. Normally check_logfiles sees the field Message when it tries to match a pattern. This is also what is shown in the plugin’s output. The option eventlogformat can be used to include the fields EventType, Source, Category, Timewritten and TimeGenerated in the output.
EventType: ERROR EventID: 16 Source: W32Time Category: None Timewritten: 1259431241 TimeGenerated: 1259431241 Message: Der NtpClient verfügt über keine Quelle mit genauer Zeit.
options => 'eventlogformat="%w src:%s id:%i %m"',
With this eventlogformat the message text of the above event will be rewritten to:
2009-11-28T19:04:16 src:W32Time id:16 Der NtpClient verfügt über keine Quelle mit genauer Zeit.
The formatstring knows the following tokens:
| %t | EventType |
| %i | EventID |
| %s | Source |
| %c | Category |
| %w | Timewritten |
| %g | TimeGenerated |
| %m | Message |
Examples
Here you can find example configurations for several scenarios.
Download
External Links
Changelog
- 3.4.2 – 2010-06-30
Bugfix, criticalexceptions now work without criticalpatterns
The argument to –tag can now contain special characters (like a file name) - 3.4.1 – 2010-05-09
Bugfix in type=eventlog (EVENTLOG_SUCCESS was shown as UnknType)
New option archivedirregexp - 3.4 – 2010-05-06
check_logfiles.exe was built with a newer compiler (PERL5LIB problems under Windows) - 3.3 – 2010-04-27
Performancetuning
New (global) option seekfileerror
The exe-file now contains Win32::Daemon - 3.2 – 2010-04-12
type=eventlog now handles remote eventlogs. Options computer,username,password can contain macros.
Faster patternmatching in tivoli-mode. - 3.1.5 – 2010-03-08
loopback option is now allowed in the config file.
matching empty lines are displayed as _(null)_ - 3.1.4 – 2010-02-25
Bugfix in the IPMI-moduleThe $PRIVATESTATE contains now the logfile name
New option preferredlevel
new option randoiminode
- 3.1.2 – 2009-12-08
Bugfix in the resolving of macros in scriptparams+external bat file - 3.1.1 – 2009-12-03
New (global) option maxlength. - 3.1 – 2009-11-22
New option allyoucaneat. New option eventlogformat. New (global) option report. More filter options for eventlog entries. - 3.0.4 – 2009-09-20
accept the contents of a config file as encoded string - 3.0.3.1 – 2009-09-07
Fixed a bug where incorrect EventIDs were read from the EventLog - 3.0.3 – 2009-08-26
Speedup in Eventlog scans- Under some OSs the daemon did not detach itself from the terminal - 3.0.2 – 2009-07-23
fixed a bug for –config. (Windows uses HOMEPATH instead of HOME)
fixed a bug in Eventlog+Tivoli (Thanks Werner Breitschmid) - 3.0.1 – 2009-06-25
fixed a bug in Eventlog+Tivoli
added match_them_all and match_never_ever as predefined patterns - 2009-06-19 3.0 new parameters –service, –install, –deinstall. check_logfiles now runs as Windows-Service.
- 2009-05-25 2.6 new parameters –lookback, –archivedir, –daemon, –warning/criticalthreshold. warning/criticalthresholds moved to options, match_them_all instead of .* on the command line
- 2009-03-27 2.5.6.1 I forgot to delete debugging output from 2.5.6
- 2009-03-27 2.5.6 Bugfixes in oraclealertlog+sticky, new parameter –macro, new parameter –nocase
- 2009-02-20 2.5.5.2 Option maxlength truncates long lines. Option winwarncrit uses Eventlog Type WARNING/ERROR instead of Patterns.
- 2009-02-02 2.5.5.1 2.5.5 was crap
- 2009-01-23 2.5.5 Bugfixes, support for Windows eventlog with Win32, multiline output
- 2008-10-30 2.4.1.9 Bugfix which allows absolute configfile-paths again
- 2008-10-24 2.4.1.8 Bugfix in $scriptpath under Windows (Thanks Markus Wagner).
- 2008-10-10 2.4.1.7 Bugfix in rotating::uniform and Macros in rotation. Bugfix in scriptparams with $CL_TAG$. Thanks Markus Wagner.
- 2008-09-03 2.4.1.6 new parameter –environment
- 2008-08-15 2.4.1.5 syslogclient hostnames can be case-insensitive (with nocase)
- 2008-07-28 2.4.1.4 Bugfix in type=uniform, scripts have access to a state-hash
- 2008-06-24 2.4.1.3 Bugfix (–sticky=<…>). Thanks Severin Rossignol.
- 2008-06-18 2.4.1.2 Bugfix in CL_DATE_YY
- 2008-05-29 2.4.1.1 Archivedir can now contain Macros
- 2008-05-27 2.4.1 Bugfix in sticky-Code. A warningpattern could downgrade a Critical to Warning. Thanks Nils Müller.
- 2008-05-07 2.4 Support for Oracle Alertlogs through a database connection.
- 2008-05-06 2.3.3 Option -F which is used to search multiple configfiles in a directory.
- 2008-02-26 2.3.2.1 Bugfix to support Perl 5.10. More encoding tinkering.
- 2008-02-12 2.3.2 Support for IPMI System Event Log, Errpt Bugfix, ucs-2 encoded files for Windows.
- 2007-12-27 2.3.1.2 Can now handle very large files, $CL_PROTOCOLFILE$, $CL_SERVICEPERFDATA$, more commandline options.
- 2007-11-16 2.3.1.1 Bugfix in sticky code. Thanks Marc Richter. New option savethresholdcount. Thanks Hannu Kivimäki.
- 2007-10-16 2.3.1 Templates, bzip2 archives, scriptparam bugfix, threshold counters are inherited.
- 2007-09-10 2.3 Bugfixes. Type errpt. Okpatterns. Options sticky and syslogclient. New format for performance data.
- 2007-06-08 2.2.4.1 Bugfix (–searches)
- 2007-06-06 2.2.4 Support for “virtual” files like Linux /proc/*
- 2007-06-05 2.2.3 Bugfixes
- 2007-06-02 2.2.2 Support for supersmart scripts with empty output.
- 2007-06-01 2.2.1 Smart scripts. Scripts can be embedded perl code.
- 2007-05-21 2.1.1 Bugfixes
- 2007-05-21 2.1 Native Windows now supported. New option –selectedsearches. New rotation method mod_log_rotate.
- 2007-05-10 2.0 Complete Redesign. Official handling of non-rotating logfiles. Performancedata.
Copyright
Gerhard Laußer Check_logfiles is released under the GNU General Public License. GPL
Author
Gerhard Laußer (gerhard.lausser@consol.de) will gladly answer your questions.
255 Responses to “check_logfiles”
-
Charles Says:
October 12th, 2009 at 22:44How can I pass a regular expression like “ORA-(03113|24762)” as an argument for –criticalexception ? Do I have to use a config file on the client side? I’m running the check via check_nrpe on my nagios server. The whole command should be like this:
[Mon Oct 12 16:32:48 root@gator: nagios] # /usr/local/nagios/libexec/check_logfiles –logfile=/ORACLE/clfyprod/oraadmin/bdump/alert_clfyprod.log –tag=clfyprod –criticalpattern=ORA- –criticalexception=”ORA-[03113|24761]” OK – no errors or warnings|clfyprod_lines=32 clfyprod_warnings=0 clfyprod_criticals=0 clfyprod_unknowns=0 [Mon Oct 12 16:43:35 root@gator: nagios] #
Which as you see works from the local command line, but on my nagios server using check_nrpe it fails due to illegal metacharacters.
[Reply]
-
Vitalik Says:
October 21st, 2009 at 2:49In a scenario with multiple criticalpatterns/warningpatterns in on search, is there a way to return all lines if multiple lines are matched in one search with separate patterns? In other words, if there is a critical pattern “panic” and a warning pattern “scsi timeout,” configured within a same search in /var/adm/messages, and if it happened so that two matching messages were written within a second one after another, how to include both matched lines in the alert? The goal is to guarantee that all matches are displayed in the alert.
Thanks!
[Reply]
lausser Reply:
October 21st, 2009 at 12:01You can use the parameter “−−report long” (or the global variable $report = ‘long’; in a config file) if you want all the matches to be displayed.
[nagios@nagsrv1 ~]$ echo "dev:0:1:2 error scsi timeout" >> /tmp/test.log [nagios@nagsrv1 ~]$ echo "panic: cannot read device" >> /tmp/test.log [nagios@nagsrv1 ~]$ check_logfiles --tag scsi --logfile /tmp/test.log \ --warningpattern 'scsi timeout' --criticalpattern 'panic' \ --report long CRITICAL - (1 errors, 1 warnings in check_logfiles.protocol-2009-10-21-09-02-02) - panic: cannot read device |scsi_lines=2 scsi_warnings=1 scsi_criticals=1 scsi_unknowns=0 tag scsi CRITICAL panic: cannot read device dev:0:1:2 error scsi timeout
If you want to display the check results only in the Nagios webinterface, you can even use “−−report html”, which will output a html table with colors.[Reply]
-
Frode Says:
October 27th, 2009 at 3:01Looks good, but I think I’ve found a bug: If you have a logfile with CRLF (dos) lineendings, the search will never find the pattern you look for and always return the OK status.
I’m seeing this on a Linux box, searching for items in a logfile that was made on a Windows box.
Maybe I’m doing it wrong?
[Reply]
-
Frode Says:
October 27th, 2009 at 7:42Ignore my previous comment – I didn’t realise that it doesn’t process a log the first time it see it – I was deleting the .seek files as I was testing the regex I was using… Ooops. :P
[Reply]
-
ARPwatch – Netzwerk Anomalien schnell und einfach erkennen « ROOT ON FIRE Says:
October 31st, 2009 at 10:04[...] verschiedensten Gründen nicht möglich, dann kann man die Logfileauswertung z.B. mit dem Plugin check_logfiles in eine Nagios Monitoring Umgebung [...]
-
Ryan Kovar Says:
November 4th, 2009 at 16:26Hi! I Love your check and use it extensively. I do have one question however; Is it possible to have it other than acceptable log entries? For example, if the log writes anything other than “none”, spit out a critical Example log output:
20091103 15:31:44.52 “none” 20091103 15:32:36.10 “none” 20091103 15:36:31.89 “none” 20091103 15:37:01.25 “ReadOnly” 20091103 15:37:09.08 “none”
Alert on Read Only
[Reply]
lausser Reply:
November 5th, 2009 at 12:36You can reverse the pattern matching by adding an exclamation mark to the regular expression. criticalpattern => ‘!none’ should do the trick. Now you get a CRITICAL each time a line does not match “none”. Gerhard
[Reply]
-
Hombre Says:
November 5th, 2009 at 23:42I have exactly the same problem with the type=errpt as described under the following link:
http://www.icinga-portal.org/wbb/index.php?page=Thread&postID=103725
Everytime I execute the script there were no patterns found, although there are lots of lines which matches the regex pattern.
thanks for your help
PS: my Version is: check_logfiles v3.0.4
[Reply]
lausser Reply:
November 6th, 2009 at 11:48Hi, there’s a difference between errpt and ordinary files. When checking the latter, check_logfiles remembers the last position in “logoffset”. Errpt however is more time-based, so check_logfiles saves a timestamp in “logtime”. Edit your statefile and set logtime to 1 (not 0!!!). The next time you run check_logfiles it will scan the entire errpt. (you can watch what happens behind the scenes if you create a trace-file with “touch /tmp/check_logfile.trace; tail -f /tmp/check_logfiles.trace”. Don’t forget to delete it later)
[Reply]
-
Stephen Says:
November 16th, 2009 at 20:40I was wondering if there is a way to check for a line position? Here is the logfile line:
[11/12/09 10:28:32:131 EST] 0000000a TrustAssociat E com.ibm.ws.security.spnego.TrustAssociationInterceptorImpl initialize CWSPN0009
The important character is E in the 52nd position. This application always places it in the 52nd position, but searching for E would result in all lines returning an error do to other E’s in the line such as EST. The application returns E, I, W in that position to inform of the type of error….
Is there any way to do this with check_logfiles?
Thanks
[Reply]
lausser Reply:
November 16th, 2009 at 21:44What about the TrustAssociat? Does this label change or is always in the lines you’re interested in? You could use “TrustAssociat E” as criticalpattern (and “TrustAssociat W” as warningpattern).
[Reply]
-
Stephen Says:
November 17th, 2009 at 15:26The Trust Associat is one of many applications in that group that can be in error. That was the first thing I asked the apps guys :) But according to them, they all put the severity flag at the same place….But the app name can change.
[Reply]
lausser Reply:
November 27th, 2009 at 20:09Maybe this works: criticalpatterns => ‘\[.*?\]\s+\w+\s+\w+\s+E\s+’ It matches the datestring, the 000000a (or any other code), another word (which is the application name) and then a standalone E.
[Reply]
-
Michael Koeppl Says:
November 25th, 2009 at 11:43Hello, ever thought about a “dryrun” parameter which did not change the offset value, so that searches can be evaluated without changing the seek file. If you would implement this feature maybe the seek file infos without the dryrun parameter should be made available in the file but with comments deactivated. So is the tester wants he can check the changes made by the run.
[Reply]
-
Vikas Vysetti Says:
November 25th, 2009 at 21:14Hi
I am looking to use check_logfiles on a standalone system. I just can’t figure out how to use it with nagios. It would be great if someone can help me out.
[Reply]
-
Norbert Says:
December 1st, 2009 at 14:27Does anyone has a working spec file for check_logfiles?
[Reply]
-
Michal Says:
December 2nd, 2009 at 15:40Hello
i think there is a bug in report parameter (in config file)
Im using following config file:
$seekfilesdir = ‘/tmp’; $report = “html”;
@searches = ( { tag => ‘PHPError’, logfile => ‘/var/log/httpd/httpd_error.$CL_DATE_YYYY$$CL_DATE_MM$$CL_DATE_DD$.log’, criticalpatterns => ‘.PHP Fatal.’, options => ‘noprotocol,noperfdata,nologfilenocry,nosavetreshholdcount,allyoucaneat’ }, );
but im Always getting short output.
I did some debuging and find out following:
if ($self->get_option(‘report’) ne “short”) { $self->formulate_long_result(); }
here is $self->get_option(‘report’) always short BUT on the same place $self->{report} is html. What could be the problem?
In case i change the code to:
if ($self->{report} ne “short”) { $self->formulate_long_result(); }
check_scripts is working as expected.
What is the reason for this please / What am I doing wrong?
Next:
It will be great to make my $maxlength = 1024; inside of formulate_long_result function configurable over config file.
Thank you for your help.
[Reply]
lausser Reply:
December 3rd, 2009 at 15:30In 3.1 report has become an option. You have to move it into $option. I just published release 3.1.1, which lets you adjust the maximum output length in the config file.
$options = "report=html,maxlength=1024";
[Reply]
-
Michal Says:
December 4th, 2009 at 1:13It looks like that download link for 3.1.1 does not work.
[Reply]
-
Ovidiu Says:
December 15th, 2009 at 17:39Hello, nice plugin but for me it doesn’t work the criticalexception feature: @searches = ( { tag => ‘test’, logfile => ‘/tmp/test.log’, criticalpatterns => ‘ORA-’, criticalexception => ‘ORA-(03113|24761)’ }, );
I have the version 3.1.2 when I execute echo “ORA-03113 dfafa” >> /tmp/test.log I get a critical return
[Reply]
lausser Reply:
December 15th, 2009 at 19:42Hi, it’s criticalexception_s_, not criticalexception. It’s important to pay attention. While on the commandline you say –criticalpattern … –criticalexception …, because only one pattern is possible here. If you use a config file, you have to use the plural criticalpatterns/criticalexceptions, because you can specify a whole array of patterns. Gerhard
[Reply]
-
Benny Says:
December 16th, 2009 at 19:36Hallo!
Ich spreche nicht gut Deutche. :(
Do you have an English version of this page? It contains a LOT of very useful information, but I haven’t found an English translation of it yet, and I don’t trust Babelfish’s accuracy that much.
Thank you so much for the plugin!
Benny
[Reply]
lausser Reply:
December 16th, 2009 at 21:46Hi, if you write “ich spreche nicht gut Deutsch” then it’s perfect!. Do you see the english flag in the top right corner of the page? Click and you’re there. Gerhard
[Reply]
-
matejo Says:
December 17th, 2009 at 15:45Hi! I have quite huge logs – sometimes they can grow over 1 GB. Is there an option to configure it so that it continuoes scan from tha last line it scanned before?
[Reply]
lausser Reply:
December 18th, 2009 at 11:57That’s the default behaviour of check_logfiles. It scans a file until it hits the end-of-file and saves the position in the so-called seek-file (usually in /var/tmp/check_logfiles). When it runs next time, check_logfiles “remembers” this position and starts reading here. This way, only the lines which were appended between the single runs of check_logfiles are scanned. The position is also used to detect logfile rotations.
[Reply]
matejo Reply:
December 18th, 2009 at 13:58@lausser, It seems it doesn’t work for me…. It doesn’t create any seek-files in that directory, neither in a directory if i specify it with $seekfilesdir=’/tmp/logCheck’; file permissons are OK.
[Reply]
matejo Reply:
December 18th, 2009 at 14:09@matejo, Forgot to tell. I have created /tmp/check_logfiles.trace. And it says that it starts everytime from beginning… moving to position 0…
[Reply]
lausser Reply:
December 20th, 2009 at 18:17Strange… can you please mail me the config file? Also please create a fresh trace-file, run check_logfiles two times and send me the trace-file too. Gerhard p.s. did you run check_logfiles as root? Maybe the seekfile(-dir) belongs to root and the nagios-user cannot write it.
[Reply]
-
Craig Says:
December 17th, 2009 at 18:13Awesome plugin…I have it in use on several systems and having a small problem with one of them. The script takes FOREVER to run, it will eventually return accurate results. On a similliar system doing Oracle Alert log checks it will run in under 10 seconds, on the second system it takes in excess of 2-3 minutes. I checked the perl modules and versions – identical, Oracle versions – identical, OS – identical. Not sure where to go from here.
Thanks
[Reply]
-
Craig Says:
December 17th, 2009 at 18:14Sorry forgot to mention this is running on HPUX 11.31
[Reply]
lausser Reply:
December 18th, 2009 at 12:07Create the file /tmp/check_logfiles.trace with touch. If this file exists, check_logfiles writes a lot of debugging stuff in it. Watch it with tail -f /tmp/check_logfiles.trace, esp. the timestamps. This might help finding out, where it hangs or spends time. Does the name resolution work correctly on this machine? In rare cases this was the reason for a hanging plugin, because check_logfiles tries to find out the hostname.
[Reply]
-
Carl Says:
December 22nd, 2009 at 20:54Is there a way to trigger CRIT or OK based on a multiline match?
Basically I have an application that produces a multiline entry per log entry. I want to return CRIT when a pattern is matched on the first line but only if the next line does not contain a specific string.
I attempted to utilize the ‘okpattern’ option but this resets to OK regardless of previous real CRIT conditions.
[Reply]
lausser Reply:
December 23rd, 2009 at 11:27check_logfiles reads the logfile line by line and treats every line separately (this means, when it reads a line, it already has forgotten the previous lines). So it is not possible to use regular expressions which span several lines. What you can do is to add your own logic with a script.
my $flag = 0; @searches = ({ tag => 'carl', logfile => 'log.log', criticalpatterns => '.*', options => 'supersmartscript', script => sub { my $line = $ENV{CHECK_LOGFILES_SERVICEOUTPUT}; $flag++ if $flag; if ($line =~ /critical phase/) { # line 1 $flag = 1; return 0; } elsif ($flag == 2 && $line !~ /fixed/) { # line 2 and not pattern 2 $flag = 0; print $line; return 2; } else { # line 2 and pattern 2 or line not following line 1 $flag = 0; return 0; } }, });
[Reply]
-
john Says:
December 26th, 2009 at 7:52Is it possible to associate an action in the next run of check_logfiles even though there is no new lines being added to the log?
[Reply]
john Reply:
December 26th, 2009 at 16:10when there is no new line being added I would like to to have a logic inside “script => sub {..” Is this possible?
@searches =( { tag => 'n', logfile => '/tmp/n.log', options => 'supersmartscript', criticalpatterns => ['ERROR', 'WARN', 'FIX'], script => sub { if ($ENV{CHECK_LOGFILES_SERVICEOUTPUT} =~ /ERROR/) { # do error logic... return 2; } elsif ($ENV{CHECK_LOGFILES_SERVICEOUTPUT} =~ /WARN/) { # do warnining logic... return 1; } elsif ($ENV{CHECK_LOGFILES_SERVICEOUTPUT} =~ /FIX/) { # do fix logic... return O; } else{ # do NO-NEW_LINE logic... # return 0, 1, 2 or 3 based on logic; } } } );
[Reply]
lausser Reply:
December 26th, 2009 at 21:38Like (supersmart)script, which is executed after each pattern match, there is also the option supersmartpostscript. It can be used to rewrite the plugin’s output and exitcode. With a criticalpattern of ‘.*’ you can call a handlerscript after each line and increase a linecounter. If this linecounter is 0, then the supersmartpostscript can handle the “no new lines”-case. You can keep your own pattern matching, but instead of “do xx logic” you code “set xx flag”.
my $linecounter = 0; my $errflag = 0; my $warnflag = 0; my $fixflag = 0; $options = 'supersmartpostscript'; @searches = .... $postscript = sub { if ($linecounter == 0) { printf "no new lines\n"; # do no-new-lines-logic return 0; } ..... };
[Reply]
-
john Says:
December 26th, 2009 at 8:16I’m using the “sticky” option to preserve the last CRIT condition. I’m monitoring a variable that has 3 possible states: FIX (okpattern), WARN (warningpatterns) and ERROR (criticalpatterns). The FIX status will reset the CRIT, but also I would like to reset CRIT when the next event is a WARNING (warningpatterns). As of today, when the var. goes from CRIT to WARN check_logfiles shows
CRITICAL – (1 errors, 1 warnings) – |s5_lines=1 s5_warnings=1 s5_criticals=1 s5_unknowns=0.
This is misleading in my case because the variable can have only 1 state at any given time. Is there a way to do this? Thanks,
[Reply]
-
Harish Says:
December 30th, 2009 at 16:20Hi All,
I have installed this script on my nagios box, but while running this, I am always get “OK” status.
Please help me.
[nagios@Nagios libexec]$ echo “dev:0:1:2 error scsi timeout” >> /tmp/t.log [nagios@Nagios libexec]$ echo “panic: cannot read device” >> /tmp/t.log [nagios@Nagios libexec]$ ./ [nagios@Nagios libexec]$ /usr/local/nagios/libexec/check_logfiles check_logfiles –tag scsi –logfile /tmp/test.log \
–warningpattern ‘scsi timeout’ –criticalpattern ‘panic’ \ –report long OK – no errors or warnings|scsi_lines=0 scsi_warnings=0 scsi_criticals=0 scsi_unknowns=0 [nagios@Nagios libexec]$ cat /tmp/t.log dev:0:1:2 error scsi timeout panic: cannot read device
[Reply]
lausser Reply:
January 7th, 2010 at 2:07Was this the first time you ran check_logfiles? From the scsi_lines=0 you see that 0 lines were scanned. This is normal behavior. The first run only initialises, that is, seeks the end of the logfile and saves the position reached. Then, with the next run, it will operate normally, do a fast forward to this saved position and then scan the lines which were added (or simply exit if no new lines were added). So call check_logfiles, call the 2 echo commands and call check_logfiles again. You should see a CRITICAL then.
[Reply]
-
Benny Says:
December 31st, 2009 at 19:52I’m getting the hang of this plugin, and I’m happy that it is working the way it is.
However, there is one gotcha… I am experimenting with using a config file to define a bunch of searches (actually, so the end users can write their own), and I notice that the alerts spit out with only the line matched, not with the log file matched.
I guess I could write a script and use $CL_TAG, but is there something built-in that I’m missing? I’m trying to get away with a single service per host that checks all the searches the users have defined…
Thanks!
Benny
[Reply]
lausser Reply:
January 7th, 2010 at 1:55Maybe you should try –report long or $options = “report=long”; in the configfile. Then you will see the matching lines grouped by tags.
[Reply]
-
haitauer Says:
January 2nd, 2010 at 1:59Hi,
report option (command line or config file) does not work in v3.1.2. Its always short.
[Reply]
lausser Reply:
January 7th, 2010 at 2:07I can’t reproduce this.
[Reply]
haitauer Reply:
January 28th, 2010 at 10:50@lausser, Hi lausser,
/dev/shm/check_logfiles-v3.1.2.pl -t 50 -f test.conf –searches=”test-cacti-partial-snmp,test-cacti-partial-cmd” WARNING – (2 warnings) – 01/28/2010 09:49:20 AM – CMDPHP: Poller[0] Host[86] DS[1543] WARNING: Result from SNMP not valid. Partial Result: U …
cat test.conf @searches = (
{ tag => 'test-cacti-partial-cmd', options => 'noperfdata,noprotocol,sticky=86400,nocase,report=long,maxlength=512', logfile => '/var/log/test-cacti/cacti.log',warningpatterns => [ 'Result from CMD not valid', ], warningthreshold => 1, criticalpatterns => [ 'Result from CMD not valid', ], criticalthreshold => 200, }, { tag => 'test-cacti-partial-snmp', options => 'noperfdata,noprotocol,sticky=86400,nocase,report=long,maxlength=512', logfile => '/var/log/test-cacti/cacti.log', warningpatterns => [ 'Result from SNMP not valid', ], warningthreshold => 1, criticalpatterns => [ 'Result from SNMP not valid', ], criticalthreshold => 200, },);
/dev/shm/check_logfiles-v3.1.2.pl -t 50 -f test.conf –searches=”test-cacti-partial-snmp,test-cacti-partial-cmd” –report long WARNING – (11 warnings) – 01/28/2010 09:50:25 AM – CMDPHP: Poller[0] Host[86] DS[1543] WARNING: Result from SNMP not valid. Partial Result: U …
/dev/shm/check_logfiles-v3.1.2.pl -t 50 -f test.conf –searches=”test-cacti-partial-snmp,test-cacti-partial-cmd” –report=long WARNING – (2 warnings) – 01/28/2010 09:50:25 AM – CMDPHP: Poller[0] Host[86] DS[1543] WARNING: Result from SNMP not valid. Partial Result: U …
[Reply]
-
haitauer Says:
January 2nd, 2010 at 19:12Hi,
with check_logfiles v3.1.2 every entry read out from the eventlog is listed twice in the check_logfiles output.
[Reply]
lausser Reply:
January 7th, 2010 at 1:53I can’t reproduce this. Maybe you have criticalpatterns so that an event matches twice?
[Reply]
-
haitauer Says:
January 3rd, 2010 at 23:29Hi,
how do I reverse the output of report=long or html? i.e. newest errors/warnings first … thanks.
[Reply]
-
haitauer Says:
January 5th, 2010 at 12:34Hi,
is it possible to do something like this:
exclude => { source => ‘Userenv’, eventid => ’1085′, operation => ‘and’, },
exclude => { source => ‘PureMessage’, eventid => ’8′, operation => ‘and’, },
i.e. I want to exclude some event IDs from defined source as eventIDs are not unique in windows, so I have to specify the source also to exclude things.
[Reply]
lausser Reply:
January 7th, 2010 at 2:14No, more than one exclude key is not possible. But i understand the problem. I’ll have a look at this.
[Reply]
-
charleshb Says:
January 5th, 2010 at 22:25What happened to English language version of this page?
[Reply]
lausser Reply:
January 7th, 2010 at 1:50Just click on the english flag you see in the right upper corner of this page.
[Reply]
-
haitauer Says:
January 6th, 2010 at 0:14hello? anyone awake here? :)
[Reply]
lausser Reply:
January 7th, 2010 at 2:19Holydays. Sorry for not providing free 7×24 support. I’m writing and maintaining this software in my leisure time.
[Reply]
-
Gene Siepka Says:
January 6th, 2010 at 18:19Hi all.. seem to be having an issue on Solaris watching /var/adm/messages.. at random times during the day I’ll get “cannot open file /var/adm/messages” and last night at 3:10am when the log rotated, seems like check_logfiles got stuck, until I got into the office and ran it manually.. Running thru NRPE if it makes any difference.. Saw this in the trace file i created:
Wed Jan 6 03:10:03 2010: ==================== /var/adm/messages ================== Wed Jan 6 03:10:03 2010: found seekfile /usr/local/encap/nagios/var/check_logfiles._var_adm_messages.messages Wed Jan 6 03:10:03 2010: LS lastlogfile = /var/adm/messages Wed Jan 6 03:10:03 2010: LS lastoffset = 1953 / lasttime = 1262712406 (Tue Jan 5 12:26:46 2010) / inode = 67174402:384568 Wed Jan 6 03:10:03 2010: found private state $VAR1 = { ‘runcount’ => 502, ‘lastruntime’ => 1262765207 };
Wed Jan 6 03:10:03 2010: this is not the same logfile 67174402:384568 != 67174402:382266 Wed Jan 6 03:10:03 2010: Log offset: 1953 Wed Jan 6 03:10:03 2010: looking for rotated files in /var/adm with pattern messages.*\.[0-9]+ Wed Jan 6 03:10:03 2010: archive /var/adm/messages.2 matches (modified Tue Dec 22 11:38:27 2009 / accessed Mon Jan 4 12:58:41 2010 / inode 377118 / inode changed Wed Jan 6 03:10:00 2010) Wed Jan 6 03:10:03 2010: archive /var/adm/messages.1 matches (modified Thu Dec 31 10:41:59 2009 / accessed Sun Jan 3 01:37:05 2010 / inode 384614 / inode changed Wed Jan 6 03:10:00 2010) Wed Jan 6 03:10:03 2010: archive /var/adm/messages.3 matches (modified Mon Jan 4 14:12:33 2010 / accessed Tue Jan 5 01:32:51 2010 / inode 366513 / inode changed Wed Jan 6 03:10:00 2010) Wed Jan 6 03:10:03 2010: archive /var/adm/messages.0 matches (modified Tue Jan 5 12:26:46 2010 / accessed Wed Jan 6 03:09:46 2010 / inode 384568 / inode changed Wed Jan 6 03:10:00 2010) Wed Jan 6 03:10:03 2010: archive /var/adm/messages.0 was modified after Tue Jan 5 12:26:46 2010 Wed Jan 6 03:10:03 2010: archive messages.0 cannot be opened Wed Jan 6 03:10:03 2010: although a logfile rotation was detected, no archived files were found Wed Jan 6 03:10:03 2010: stat (/var/adm/messages) failed, try access instead Wed Jan 6 03:10:03 2010: could not open logfile /var/adm/messages Wed Jan 6 03:10:03 2010: first relevant files: Wed Jan 6 03:10:03 2010: relevant files: Wed Jan 6 03:10:03 2010: nothing to do Wed Jan 6 03:10:03 2010: keeping position 1953 and time 1262712406 (Tue Jan 5 12:26:46 2010) for inode 67174402:384568 in mind
Any ideas? This is a great plugin and seems to be the only one that can pattern match and then do exceptions for crap we dont want to be alerted on..
[Reply]
lausser Reply:
January 7th, 2010 at 2:34The trace looks normal. Well, normal for a situation where the nagios-user cannot read the logfile. I know there are a lot of solaris-users running check_logfiles, but i never heard of a problem like this. It looks like during/a short time after the rotation, the logfiles are not world-readable. The rotation detection works. You see inode=67174402:384568. This is the device/inode of the messages file when check_logfiles was run last time. Now it’s inode has changed. The old 67174402:384568 appears also, but as that of messages.0. If check_logfiles only could open the files… How is this rotation managed? Is there something like /etc/logrotate.conf? Any chance to add some chmod to the rotation script?
[Reply]
Gene Siepka Reply:
January 7th, 2010 at 18:43Yes its /etc/logadm.conf in Solaris10. It rotates the log weekly and renames /var/adm/messages to /var/adm/messages.0, then .0 to .1 etc…
I did a force log rotate just now and see the same results.. checked the permissions on /var/adm/messages and /var/adm/messages.0 and they are fine, nagios userid should be able to read them. Here is some more info:
ls -la /var/adm/messages
-rw-r—– 1 root sysadmin 0 Jan 7 11:14 /var/adm/messages
ls -la /var/adm/messages.0
-rw-r—– 1 root sysadmin 224 Jan 6 12:32 /var/adm/messages.0
id -a nagios
uid=502(nagios) gid=14(sysadmin) groups=500(nagios)
and trace entry again:
Thu Jan 7 11:19:01 2010: ==================== /var/adm/messages ================== Thu Jan 7 11:19:01 2010: found seekfile /usr/local/encap/nagios/var/check_logfiles._var_adm_messages.messages Thu Jan 7 11:19:01 2010: LS lastlogfile = /var/adm/messages Thu Jan 7 11:19:01 2010: LS lastoffset = 224 / lasttime = 1262799146 (Wed Jan 6 12:32:26 2010) / inode = 67174402:382266 Thu Jan 7 11:19:01 2010: found private state $VAR1 = { ‘runcount’ => 982, ‘lastruntime’ => 1262880561 };
Thu Jan 7 11:19:01 2010: this is not the same logfile 67174402:382266 != 67174402:384476 Thu Jan 7 11:19:01 2010: Log offset: 224 Thu Jan 7 11:19:01 2010: looking for rotated files in /var/adm with pattern messages.*\.[0-9]+ Thu Jan 7 11:19:01 2010: archive /var/adm/messages.2 matches (modified Thu Dec 31 10:41:59 2009 / accessed Thu Jan 7 00:22:02 2010 / inode 384614 / inode changed Thu Jan 7 11:14:26 2010) Thu Jan 7 11:19:01 2010: archive /var/adm/messages.1 matches (modified Tue Jan 5 12:26:46 2010 / accessed Thu Jan 7 00:22:02 2010 / inode 384568 / inode changed Thu Jan 7 11:14:26 2010) Thu Jan 7 11:19:01 2010: archive /var/adm/messages.3 matches (modified Tue Dec 22 11:38:27 2009 / accessed Thu Jan 7 00:22:02 2010 / inode 377118 / inode changed Thu Jan 7 11:14:26 2010) Thu Jan 7 11:19:01 2010: archive /var/adm/messages.0 matches (modified Wed Jan 6 12:32:26 2010 / accessed Thu Jan 7 11:10:13 2010 / inode 382266 / inode changed Thu Jan 7 11:14:26 2010) Thu Jan 7 11:19:01 2010: archive /var/adm/messages.0 was modified after Wed Jan 6 12:32:26 2010 Thu Jan 7 11:19:01 2010: archive messages.0 cannot be opened Thu Jan 7 11:19:01 2010: although a logfile rotation was detected, no archived files were found Thu Jan 7 11:19:01 2010: stat (/var/adm/messages) failed, try access instead Thu Jan 7 11:19:01 2010: could not open logfile /var/adm/messages Thu Jan 7 11:19:01 2010: first relevant files: Thu Jan 7 11:19:01 2010: relevant files: Thu Jan 7 11:19:01 2010: nothing to do Thu Jan 7 11:19:01 2010: keeping position 224 and time 1262799146 (Wed Jan 6 12:32:26 2010) for inode 67174402:382266 in mind
If it helps this is my config file. kind of lengthy, sorry for the wall of text:
cat /usr/local/encap/nagios/etc/check_logfiles.cfg
@searches = ( { tag => ‘messages’, logfile => ‘/var/adm/messages’, rotation => ‘SOLARIS’, criticalpatterns => [ 'pamsmb', 'offlin', 'Offlin', 'OFFLINE', 'fault', 'Fault', 'FAULT', 'fail', 'Fail', 'FAIL', 'down', 'Down', 'emerg', 'Emerg', 'EMERG', 'alert', 'Alert', 'ALERT', 'crit', 'Crit', 'CRIT', 'err', 'Err', 'ERR', 'xntpd.time reset', 'kern' ], criticalexceptions => [ 'My unqualified host name.unknown', 'WARNING.forceload', 'Command terminated on signal 9', 'sshd', 'TLD.going to UP state', 'ntpdate', 'ttsession', 'Tt_session ', 'GMT LOM time reference ', 'Automatic cleaning of', 'MQSeries.FFST', 'using kernel phase-lock loop', 'chiunix-mq.FFST record created', 'postfix.watchdog timeout', 'named.enforced delegation-only', 'Computer Associates Licensing', 'failure detection time', 'myin.incorrect password', 'kern.info.devinfo0', 'named.* dispatch .* connection reset', 'no cleaning tape available', 'postfix.timeout.status', 'LOGOUT for port id', 'itmpt0.RESCAN', 'rsync. name lookup failed', '/stage. file system full', 'IOCStatus = 804b', 'lw8. . Main, up', 'zcons.online', 'rsync error.some files could not be transferred', 'incorrect password attempt', 'WARNING pools facility is disabled', 'rsyncd.*daemon.warning', ], })
And again, if I run the check_logfiles manually on the server it runs it correctly, notices the logfile was rotated and is happy. Starting to think maybe something is wrong running this thru NRPE.
[Reply]
lausser Reply:
January 8th, 2010 at 11:41Maybe nrpe runs as nagios:nagios as opposed to nagios:sysadmin?
[Reply]
Gene Siepka Reply:
January 11th, 2010 at 21:05While at first I shrugged this off, knowing that the nagios user did have its primary group as “sysadmin”, same as the file permission…
But got me thinking and actually you were right.. I had compiled nrpe before making the groupid change, and because of that the nrpe daemon was indeed running as nagios:nagios instead of nagios:sysadmin. re-compiled nrpe and rotated my log several times.. check_logfiles picked it up right away.
Thanks for the suggestion and great plugin!
[Reply]
-
matejo Says:
January 12th, 2010 at 14:09Hello!
Is there an option so that the output of the plugin includes all error messages which it discoverd since last scan?
I have used: $options = “report=long,maxlength=8192″;
But all I see in nagios is the last out of 13 error strings it has found?
[Reply]
lausser Reply:
January 14th, 2010 at 23:01strange… so this means you only get a single line?
[Reply]
matejo Reply:
January 15th, 2010 at 16:32@lausser, yes… only single line…
[Reply]
lausser Reply:
January 15th, 2010 at 18:51Do you have the latest version of the plugin? Can you mail me the config file and the command line parameters you used?
[Reply]
flo Reply:
January 21st, 2010 at 9:53@lausser, I have the same problem. My application always logs TWO lines containing ‘ERROR’ but only the first line is useful. with my config attached below I always get the second line as output for nagios… my version is 3.1.2 the commandline includes the -f option only
my config-file: $protocolretention = 14; $options=”report=long”; @searches = ( { tag => ‘Source’, logfile => ‘/var/icoserve/logs/Source.log’, criticalpatterns => ['.WARNING.', '.ERROR.' ], archivedir => ‘/var/icoserve/logs/archive’, rotation => ‘Source\.log\.\d+\.gz’ });
[Reply]
lausser Reply:
January 22nd, 2010 at 2:25i create some test messsges
echo "text" >> Source.log echo "1ERROR1" >> Source.log echo "1WARNING1" >> Source.log echo "2ERROR2" >> Source.log echo "2WARNING2" >> Source.log
then i call check_logfiles and i get 4 linescheck_logfiles --config cfg.cfg CRITICAL - (4 errors in cfg.protocol-2010-01-22-01-16-01) - 2WARNING2 ...|Source _lines=5 Source_warnings=0 Source_criticals=4 Source_unknowns=0 tag Source CRITICAL 1ERROR1 1WARNING1 2ERROR2 2WARNING2
With a nagios3 you should see all the lines in the web interface. But notifications usually only show the first line, because the macro $SERVICEOUTPUT$ is used in the notification command. The long output is in $SERVICELONGOUTPUT$Stephen Sunners Reply:
February 26th, 2010 at 13:51HI – I seem to have the same issue , if I specify the report=long/report=html on the command line it works fine , but the $options seem to be ignored in the config file , so i must be doing something wrong :-)
I am running version 3.1.2
put values in log file
$ echo “1ERROR1″ >> SS.log $ echo “1ERROR1″ >> SS.log $ echo “1WARNING1″ >> SS.log $ echo “21ERROR12″ >> SS.log
run on the command line
$ /usr/local/nagios/libexec/check_logfiles –logfile=/opt/nagios/ss-nagios/SS.log –tag=abc –criticalpattern=’ERROR’ –warningpattern=’WARNING’ –report html CRITICAL – (3 errors, 1 warnings in check_logfiles.protocol-2010-02-26-11-35-17) – 21ERROR12 …|abc_lines=4 abc_warnings=1 abc_criticals=3 abc_unknowns=0
tag abc1ERROR11ERROR121ERROR121WARNING1
works fine
show config file
$ cat cfg.cfg
@searches = ({ tag => ‘abc’, logfile => ‘/opt/nagios/ss-nagios/SS.log’, criticalpatterns => [ 'ERROR' # error in reading control file ], warningpatterns => [ 'WARNING' # end of file on communication channel ],
options => [ 'noprotocol', 'report=html' ] });
put values in logfile
$ echo “1WARNING1″ >> SS.log $ echo “21ERROR12″ >> SS.log
run using cfg.cfg
[nagios@localhost ss-nagios]$ /usr/local/nagios/libexec/check_logfiles -f cfg.cfg CRITICAL – (1 errors, 1 warnings in cfg.protocol-2010-02-26-11-36-31) – 21ERROR12 |abc_lines=2 abc_warnings=1 abc_criticals=1 abc_unknowns=0
$options ignored
[Reply]
lausser Reply:
February 26th, 2010 at 15:16report does not belong to the options of a single search. It’s a global setting, because long/html output affects all the @searches members (even you the array has only one element). Try this:
$options = 'report=long'; @searches = ({ ... options => 'noprotocol', });
-
flo Says:
January 14th, 2010 at 11:17Hi,
I have this situation: My logfile rotation is almost like described in scheme loglog0gzlog1gz. The only difference is, that the rotation is starting with log.1.gz (log.0.gz is not created) Can I use this scheme without problems?
For now i tried with: rotation => ‘Source\.log\.\d+\.gz’ But everytime a logfile containing errors is rotated again i get a error raised :(
I hope you can provide any helpful hints…
best regards flo
p.s.: Very GREAT work!!!
[Reply]
lausser Reply:
January 14th, 2010 at 23:02Yes, loglog0log1gz should work. Which kind of error did you get?
[Reply]
flo Reply:
January 21st, 2010 at 9:46with “I get an error raised” I meant that check_logfiles returns critical when the error gets rotated but no new error is in the main logfile… I’ll try with loglog0log1gz and keep an eye on it. thanks anyway for providing free support here :)
[Reply]
lausser Reply:
January 22nd, 2010 at 2:22create the file /tmp/check_logfiles.trace and watch it with “tail -f /tmp/check_logfiles.trace” while the plugin is running. You will see some debugging output which might shed light on this.
[Reply]
-
Sergio Guzman Says:
January 25th, 2010 at 21:52Hi, Great product!!! I’m trying to work with a Windows share mounted in Linux where I run check_logfiles against files created by Windows, the problem I have is that the “devino” value keeps changing but is the same file. It’s working ok, with an old version of Linux (2.6.17) but in (2.6.29) it keeps changing the devino, do you any idea what can I do?
Maybe modifying the plugin so it ignores the devino and and treats the file as the same file?
Thanks in advance for any help you can give me.
[Reply]
lausser Reply:
January 26th, 2010 at 13:22Ignoring devino would render the plugin completely useless, as the rotation detection depends on this value. I have no idea what has changed in the linux kernel, but maybe there is a mount option to get the old behavior?
[Reply]
Sergio Guzman Reply:
January 26th, 2010 at 17:02@lausser, The log file in this case is created once per day and it’s called MQlog-1.27.2010.log so there should be no problem ignoring the rotation as the file changes every day, I have the file called:
logfile => ‘/mnt/shares/logs/MQlog-$CL_DATE_mm$.$CL_DATE_dd$.$CL_DATE_YYYY$.log’
(I modified your plugin to have this new variables)
CL_DATE_mm => 1 -> January CL_DATE_dd => 9 instead of 09
Thanks, Sergio,
[Reply]
lausser Reply:
January 27th, 2010 at 21:51Ah, ok. Instead of modifying the plugin (which you have to repeat with every new release) you could also create the logfilename in the configfile. my($sec, $min, $hour, $mday, $mon, $year) = (localtime)[0, 1, 2, 3, 4, 5]; $logfile = sprintf “MQlog-%d.%d.%d.log”, …
and then in the @search logfile => $logfile
[Reply]
-
Coda Says:
January 29th, 2010 at 13:26Hello lausser! I really love your script!
I have a quick question that I’m trying to figure out: If I use a config file with multiple searches, Is there any way to use the ‘–logfile=’ parameter (on the command line) instead of setting it in the config file?
I mean, I execute your script remotely, and I have many oracle alert logs from different servers that I would like to check, but they are all not located in the same directory, so I would like to use the same config file (multiple searches) and be able to specify the logfile name from command line.. Is that possible?
Bests Regards, and sorry for my poor english.. Pablo.
[Reply]
lausser Reply:
January 30th, 2010 at 23:47Sorry, there is no way to mix a config file and command line parameters. You might consider to write a little perl code in the config file where you set a $logfile variable .
Somehow you have to find out, which is the correct logfile path for the machine, check_logfiles is running on.foreach ("/path1/alertlog", "/path2/alertlog",...) { $logfile = $_ if -f $_; } @searches = ({ logfile => $logfile, ...
[Reply]
-
Matt Hawkins Says:
February 1st, 2010 at 23:15Lausser,
This is a great plugin and I use it a lot.
I was wondering if there is an option to limit the amount of lines written to the protocol file. This would help in situations where there are thousands of match lines being written to the protocol file and it can fill up the /tmp file system if not caught in time.
Matt
[Reply]
lausser Reply:
February 2nd, 2010 at 15:22I understand, but…no, there is no such limit. But you could set the $protocolretention parameter to 1 (default is 7), so protocolfiles older than 1 day will be deleted automatically.
[Reply]
-
Matt Hawkins Says:
February 2nd, 2010 at 18:42Lausser,
Thanks for the response.
Matt
[Reply]
-
Ben Says:
February 3rd, 2010 at 4:23Hi, I have an odd application that uses log file rotation (appends .0 .. .9) but doesn’t have a main log file. That means that it just overwrites the .1, .2, …. files so the only way to know which is the current log file is to sort by date. Do you have any advice for how to handle that? I’m running on windows but i could set up a script if you give me an idea how to do it. Thanks!!
[Reply]
-
lausser Says:
February 3rd, 2010 at 17:35You mean there is always a fixed set of files (x.0, x.1, x.2,…) and you application just selects one of them, overwrites it and after a certain amount of time/lines it overwrites another one?
[Reply]
Ben Reply:
February 3rd, 2010 at 18:08@lausser, yes it’s a “ring” where it goes from .9 to .0, .1,…. .9, .0,.1 etc and the only way to know which one is the current one is to sort by date.
i can’t notice a pattern in file changes, neither file size nor file date (when files are switched) have any logic. it’s just jumping to the next .X file after “a while” and it usually goes through a few files per day.
[Reply]
Ben Reply:
February 3rd, 2010 at 22:14@Ben, i noticed that this DOS command will list my logs by date: dir /o:d /t:w /b “C:\myapp\log\log*” but i’m not sure how to make it work inside the config file. i tried foreach (
dir /o:d /t:w /b "C:\myapp\log\log*") { $logfile = $_ if -f $;} but this doesn’t work and fails with errors: Use of uninitialized value in pattern match (m//) at script/check_logfiles line 1183. Use of uninitialized value $[0] in substitution (s///) at C:/strawberry/perl/li b/File/Basename.pm line 338. fileparse(): need a valid pathname at script/check_logfiles line 1993Help is appreciated. Thanks!!
[Reply]
lausser Reply:
February 5th, 2010 at 1:15Try this:
This should do what you intend. Always the file with the newest modification time is the current logfile. Please create an empty file C:\TEMP\check_logfiles.trace and have an eye on it. As long as this file exists, check_logfiles writes debugging informations in it. You will see what goes on behind the scenes. (Change the tracefile parameter in the config file if you prefer another path).$tracefile = 'C:\TEMP\check_logfiles.trace'; @searches = ({ type => 'rotating::uniform', # this is a regexp, thats why you need double backslashes rotation => 'C:\\myapp\\log\\log\.\d+', # no logfile => necessary });
[Reply]
Ben Reply:
February 7th, 2010 at 3:28@lausser, Thanks for the reply! i tried this but it’s not working, i’m getting errors for some reason…
Use of uninitialized value in pattern match (m//) at script/check_logfiles line 1183. Use of uninitialized value $_[0] in substitution (s///) at C:/strawberry/perl/lib/File/Basename.pm line 338. fileparse(): need a valid pathname at script/check_logfiles line 1993
[Reply]
lausser Reply:
February 7th, 2010 at 16:27Please make a DIR C:\myapp\log I’d like to know which files exist, their timestamps and size. If it’s not well formatted in a response posting here, please mail me the output.
[Reply]
Ben Reply:
February 8th, 2010 at 18:24@lausser, Hi, here’s the dir C:\myapp\log as you requested: 02/08/2010 11:00 AM 98 log.0 02/08/2010 11:11 AM 100 log.1 02/08/2010 11:05 AM 99 log.2 02/08/2010 11:02 AM 100 log.3 4 File(s) 397 bytes This is on a test machine so the log files are just dummy ones. The trace file is not created and i’m only using the exact code you provided earlier for the config file. Thanks again for taking the time!
lausser Reply:
February 9th, 2010 at 14:05Sorry, i forgot to mention you have to create the tracefile yourself. (simply with “echo start > C:\TEMP\check_logfiles.trace”) As soon as check_logfiles detects the existance of a tracefile, it starts writing debugging stuff into it. (When you delete the file later, it will not be written any more)
Ben Reply:
February 10th, 2010 at 16:28@lausser, I created the file manually but it stays empty due to the error… when i’m not using the regex but rather assign a log file, it automatically created the TEMP dir and the trace file. so there’s no debug information with the settings you suggested. could there be anything that we’re missing here? Thanks!!
lausser Reply:
February 11th, 2010 at 2:31my fault. i didn’t use rotating::uniform for a long time, i showed you a wrong config. try this:
$tracefile = 'C:\TEMP\check_logfiles.trace'; @searches = ({ type => 'rotating::uniform', # a dummy logfile entry. it is used only because it # shows the plugin which directory to look in logfile => 'C:\myapp\log\i_dont_exist', # now the pattern for rotated files (in c:/myapp/log) rotation => 'log\.\d+', criticalpatterns => '........ });
-
Matt Hawkins Says:
February 10th, 2010 at 16:45Lausser,
A lot of my logs have pipe ‘|’ symbols in their lines. expmple “syslog1[2843]: A|AEiSBh|Feb 9 07:48:27 2010|log.log.app.xmlProxySvr.5010|5010|server| 2843|det |router_utils.cpp| error”
This causes issues with the service view in Nagios because it put everything after the | as perf data. Is there any way to have Nagios ignore that? Or would I have to create a postscript to replace the | symbols?
[Reply]
-
Matt Hawkins Says:
February 10th, 2010 at 19:52This is what we did to remove the “|” character from the check_logfiles service output. Let me know if there is a better way of doing this.
”’ @searches = ({ tag => ‘nagios’, logfile => ‘/tmp/mylog.log’, criticalpatterns => ‘.*’, options => ‘supersmartscript,protocol,count’, script => sub { my $line = $ENV{CHECK_LOGFILES_SERVICEOUTPUT}; if ($line =~ m/error/) { $line =~ s/\|/\;/g; print $line; return 2; } }, }); ”’
[Reply]
lausser Reply:
February 11th, 2010 at 2:01a supersmartscript which replaces the pipe-symbols on the fly is ok. you already found the best solution. why do you configure .* as criticalpattern and then check for a /error/ in the handler script? why not write
... criticalpatterns => 'error', options => 'supersmartscript', script => sub { (my $line = $ENV{CHECK_LOGFILES_SERVICEOUTPUT}) =~ s/\|/\;/g; print $line; return 2; }
[Reply]
S. Groth Reply:
July 5th, 2010 at 16:44@lausser, We have many tags in one check_logfiles definition, so supersmartscript ist not the best solution in this way. If I’m using smartpostscript or supersmartpostscript, I always get an additional output “tag postscript WARNING”. The only thing I want to do ist replace | with ; in the whole output on about 20 tags wihtout changing the returncode. Any ideas ? … $options=”report=long,smartpostscript”; @searches = …
Replace | with ;
$postscript = sub { (my $line = $ENV{CHECK_LOGFILES_SERVICEOUTPUT}) =~ s/\|/\;/g; print $line; }
[Reply]
lausser Reply:
July 8th, 2010 at 13:12Can you add this to the supersmartscript?
return $ENV{CHECK_LOGFILES_SERVICESTATEID};
[Reply]
S. Groth Reply:
August 5th, 2010 at 10:16@lausser, …on holiday for the last 4 weeks… so I have to add options => ‘……,supersmartscript’ on each tag ??? with script => sub { (my $line = ENV{CHECK_LOGFILES_SERVICEOUTPUT}) =~ s/\|/\;/g; print $line; return $ENV{CHECK_LOGFILES_SERVICESTATEID}; } No shorter way ???
[Reply]
lausser Reply:
August 5th, 2010 at 10:45The config file is a perl program.
my $handler = sub { .... } @searches = ({ tag => 'tag1', script => $handler, ... tag => 'tag2', script => $handler, ...
-
Matt Hawkins Says:
February 11th, 2010 at 17:06I tried that but I kept getting a exit code of 1 even if no matching lines in the log file. I believe I had a misplaced bracket somewhere. :)
Anyway I have updated it to use the criticalpattern instead and it is working now.
Thanks for the help
[Reply]
-
isnochys Says:
February 19th, 2010 at 16:12Hi,
using the windows executable, he cannot create a status file: cannot write status file c:\temp/export.log looks like the filename begins with “/” but should be “\” under windows Using $seekfilesdir doesn’t change it
[Reply]
lausser Reply:
February 20th, 2010 at 0:28Can you show me your configuration file? The backslash is only necessary with the CMD.EXE shell. Inside a program or a perl-script you can use the normal slash as separator as well.
[Reply]
isnochys Reply:
February 25th, 2010 at 11:36@lausser, “cannot write status file C:\opt\/ExportTestO”
$seekfilesdir = “C:\\opt\\”; $protocolssdir = ‘C:\opt’; $MACROS ={ GOMESDIR => ‘D:\Projects\xxx’, GOMESDIRP => ‘D:\Projects\xxx’};
@searches =({ tag => ‘xxxITUQA’, logfile => ‘$GxxDIR$\export\testorder\log\*.log’, warningpatterns => [ "Warning"], options => ‘noprotocol’ });
[Reply]
lausser Reply:
February 25th, 2010 at 17:56You can’t use wildcards in the logfile …testorder\log\*.log
The status filename is derived from the logfile name, that’s why it doesn’t work.
[Reply]
-
Ben Says:
February 19th, 2010 at 19:01Hi, I’m trying to check the windows event log for a faulting application (error / warning). I have an event from a few weeks ago recorded (“Faulting application nstray.exe”) but the “allyoucaneat” option does not appear to work on the event log, because I’m getting “OK – no errors or warnings|evt_log_lines=0″ even when removing the seek file. Can I force it somehow to read ALL of it? Here’s my code: [code] @searches = ( { tag => 'evt_log', criticalpatterns => '.*', type => 'eventlog', options => 'eventlogformat="%w src:%s id:%i %m",noprotocol,nocase,maxlength=1024,report=long,allyoucaneat', eventlog => { eventlog => 'application', include => { source => 'Application Error', eventtype => 'error,warning', }, }, }, );[/code] Thanks!!
[Reply]
lausser Reply:
February 20th, 2010 at 0:25You’re right. I didn’t implement allyoucaneat for the eventlog type. I’ll have a look at it. Meanwhile you can try
It will reset the data in the seekfile so that the plugin should scan all of the eventlog.check_logfiles --config <cfgfile> --reset
[Reply]
-
angry_admin Says:
February 24th, 2010 at 13:49http://ideas.nagios.org/a/dtd/22035-3955
[Reply]
-
Derek Says:
March 2nd, 2010 at 19:25Is there no way to handle a situation like this?
/etrade/home/edwinst1/scripts/logs/backuplog/db2backup_dw_prd1_20100116_0743.log
The datestamp is handled using $CL_DATE_ variables but I have no way of knowing what the timestamp of the log will be. Stupid app adds HHMM to the log name for some reason. Be great if I could just use _????.log and check_logfiles would just use the most recent matching log file name.
[Reply]
lausser Reply:
March 2nd, 2010 at 23:07check_logfiles already handles the weirdest situation, guessing filenames or finding logfiles by regular expression alas is beyond the scope of this tool. What you can do:
The configfile is simply a piece of perl-code. Why not write
An alternative would be rotating::uniform. (look above in these comments, there already is an example)code...code...code $logfile = what i found to be the current logfile; @searches = ({ .... logfile => $logfile, options => 'allyoucaneat', #start from the beginning .... });
Now always the newest logfile is considered the current, active logfile and all the others are considered rotated archives.$tracefile = 'a file where debugging will be written to'; @searches = ({ type => 'rotating::uniform', # a dummy logfile entry. it is used only because it # shows the plugin which directory to look in logfile => '/home/edwinst....backuplog/i_dont_exist', # now the pattern for rotated files (in ..../backuplog) rotation => 'db2backup_dw_prd\d+_\d{8}_\d+\.log', criticalpatterns => '........ });
Create the tracefile with the touch-command and watch it’s contents with tail -f.
Play around with it, it should work.
[Reply]
-
Derek Says:
March 2nd, 2010 at 23:06Did this but it still gets an UNKNOWN error if there are no valid log files. I “think” it works other than that… See issues?
$scriptpath = ‘/pkgs/linux/intel/nagiosplug/et0.1/libexec’; @searches = (); foreach my $logfile (glob ‘/home/edwinst1/scripts/logs/backuplog/db2backup_dw_prd1_*.log’) { next if (-M “$logfile” > 8); push(@searches, { tag => basename($logfile), logfile => $logfile, options => ‘protocol,count’, criticalpatterns => ['ERROR','DB2\sbackup.+failed'] }); } 1;
[Reply]
lausser Reply:
March 2nd, 2010 at 23:12If you expect situations where no valid logfile exists, you need to set options=>’nologfilenocry’ to suppress the UNKNOWN.
[Reply]
-
JK Says:
March 4th, 2010 at 16:26Thank you for that great plugin. I have one issue: Is it possible to include the tag and logfile parameter in the output of the plugin?
[Reply]
lausser Reply:
March 4th, 2010 at 17:11If you use the option report=long, then the tag is also shown in the output. Tag and logfile are available as environment variables to handler scripts. Something like this is possible:
This adds tag and current logfile as prefix to the matched lines. Of course, this will bloat your output. Alternatively you might have a look at supersmartpostscript. (See the examples page).@searches = ({ tag => 'xyxy', logfile => 'xyxy.log', options => 'supersmartscript', script => sub { printf "%s - %s - %s\n", $ENV{CHECK_LOGFILES_TAG}, $ENV{CHECK_LOGFILES_LOGFILE}, $ENV{CHECK_LOGFILES_SERVICEOUTPUT}; return $ENV{CHECK_LOGFILES_SERVICESTATEID}; }, ....
[Reply]
-
Ruben Says:
March 5th, 2010 at 12:17Hi,
thanks a lot for your plugin, it’s very useful. I have a problem with the Windows version plugin: if I execute it with the “criticalexception” param, I get an error message that says “Unknown option”. You have below the whole error message.
Best regards.
C:\ARCHIV~1\NAGIOS~1\plugins>check_logfiles.exe –logfile=”test.log” –criticalpattern=”Error” –criticalexception=”Invalid credentials” Unknown option: ûcriticalexception This Nagios Plugin comes with absolutely NO WARRANTY. You may use it on your own risk! Copyright by ConSol Software GmbH, Gerhard Lausser.
This plugin looks for patterns in logfiles, even in those who were rotated since the last run of this plugin.
You can find the complete documentation at http://www.consol.com/opensource/nagios/check-logfiles or http://www.consol.de/opensource/nagios/check-logfiles
Usage: check_logfiles [-t timeout] -f
The configfile looks like this:
$seekfilesdir = ‘/opt/nagios/var/tmp’;
where the state information will be saved.
$protocolsdir = ‘/opt/nagios/var/tmp’;
where protocols with found patterns will be stored.
$scriptpath = ‘/opt/nagios/var/tmp’;
where scripts will be searched for.
$MACROS = { CL_DISK01 => “/dev/dsk/c0d1″, CL_DISK02 => “/dev/dsk/c0d2″ };
@searches = ( { tag => ‘temperature’, logfile => ‘/var/adm/syslog/syslog.log’, rotation => ‘bmwhpux’, criticalpatterns => ['OVERTEMP_EMERG', 'Power supply failed'], warningpatterns => ['OVERTEMP_CRIT', 'Corrected ECC Error'], options => ‘script,protocol,nocount’, script => ‘sendnsca_cmd’ }, { tag => ‘scsi’, logfile => ‘/var/adm/messages’, rotation => ‘solaris’, criticalpatterns => ‘Sense Key: Not Ready’, criticalexceptions => ‘Sense Key: Not Ready /dev/testdisk’, options => ‘noprotocol’ }, { tag => ‘logins’, logfile => ‘/var/adm/messages’, rotation => ‘solaris’, criticalpatterns => ['illegal key', 'read error.$CL_DISK01$'], criticalthreshold => 4 warningpatterns => ['read error.$CL_DISK02$'], } );
C:\ARCHIV~1\NAGIOS~1\plugins>
[Reply]
lausser Reply:
March 5th, 2010 at 12:49Did you copy&paste the error message to your comment? I see a strange character here: ….Unknown option: ûcriticalexception …
The –criticalexception does work, i just doublechecked it. Please try it again.
Please type the comand yourself, do not copy&paste from this website. I have a suspicion that wordpress messes up the page contents (as it does with the double-dash)check_logfiles.exe --logfile "test.log" --criticalpattern "Error" --criticalexception "Invalid credentials"
[Reply]
-
Steven Says:
March 10th, 2010 at 19:10“In principle check_logfiles scans a log file until the end-of-file is reached. The offset will then be saved in a so-called seekfile. The next time check_logfiles runs, this offset will be used as the starting position inside the log file”
Where is this so-called seekfile ? I want to delete it during my tests…
[Reply]
lausser Reply:
March 11th, 2010 at 13:08By default it will be in the directory /var/tmp/check_logfiles (unless you specify another directory with the $seekfilesdir parameter). The filename of the seekfile is composed from the tag and the logfile’s name.
[Reply]
-
jack Says:
March 23rd, 2010 at 15:46Hi,
Problem with check_logfiles in command line, I have a logfile with this message “SCR 313 KO” and “SCR 313 OK” ( without “). Whith the following command line, check_logfile send a critical alert for KO an OK messages.
/usr/lib64/nagios/plugins/check_by_ssh -H xx.xx.xx.xx -C ‘./libexec/check_logfiles –logfile=’/tmp/jmi.log’ –criticalpattern=’SCR 313 KO”
I try with the following command but i have the message Could not open pipe :
/usr/lib64/nagios/plugins/check_by_ssh -H xx.xx.xx.xx -C ‘./libexec/check_logfiles –logfile=’/tmp/jmi.log’ –criticalpattern=”SCR 313 KO”‘ Could not open pipe: /usr/bin/ssh xx.xx.xx.xx ‘./libexec/check_logfiles –logfile=/tmp/jmi.log –criticalpattern=”SCR 313 KO”‘
Any ideas ? Many thanks
[Reply]
lausser Reply:
March 24th, 2010 at 16:26That’s a problem with check_by_ssh and quoting/escaping. This may help: http://osdir.com/ml/network.nagios.plugins/2007-06/msg00047.html I don’t use check_by_ssh myself, ask the nagios-users mailing list and surely somebody will show you the trick.
[Reply]
-
Benny Says:
March 23rd, 2010 at 21:55Hi all,
I am using this plugin to check Windows event logs, and I’m pretty damned happy that it’s working great! It’s the only plugin/agent I’ve found yet that is accurate and consistent. Happy day.
However, I notice that I can’t seem to get command-line checking working. Ie, from your example above:
check_logfiles –type ‘eventlog:eventlog=application,include,source=Windows Update Agent,eventtype=error,eventtype=warning,exclude,eventid=15,eventid=16′
Any permutation of command-line stuff I try simply gives me the usage message, including your example. Is this no longer supported? It would be nice to build a command like this rather than having to distribute a bunch of .cfg files like I am at the moment while I test.
Thank you!
Benny
[Reply]
lausser Reply:
March 24th, 2010 at 15:57Good catch. The example works with the Windows Power Shell, but it fails with the DOS box. It’s the single quotes. I debugged it and saw, when you use single quotes in a DOS box, the argument of the –type parameter is truncated after the “Windows”. I didn’t know that a space character inside single quotes behaves like that. Please use double quotes instead, then it will work. I’ll also correct the example.
check_logfiles --type "eventlog:eventlog=application,include,source=Windows Update Agent,eventtype=error,eventtype=warning,exclude,eventid=15,eventid=16"
[Reply]
-
Martin Baddie Says:
March 23rd, 2010 at 22:42How can I create different alarms for every detected line. for example between 2 consecutive runs 10 errors was detected but when check_logfiles runs it only detects and prints out last error line (10th error). How can I change this behaviour so I can see all errors on one alarm even it has lots of characters (words)
[Reply]
lausser Reply:
March 24th, 2010 at 15:59Have a look at the options. report=long might be what you’re looking for. It will output not only the last matching line but all ot the matches.
[Reply]
Martin Baddie Reply:
March 24th, 2010 at 16:52Still same. I have also tried to use http://labs.consol.de/nagios/check_logfiles/check_logfiles-beispielecheck_logfiles-examples/ “Example 3: Again, but this time with a notification for each single hit” but I think I am missing a point here. I can successfully use send_ncsa but using send_ncsa in check_logfiles doesn’t work
[Reply]
lausser Reply:
March 24th, 2010 at 19:22First, have a look at the internal processing with
Don’t forget to delete this file later. As long as it exists, check_logfiles will write debugging info into it. Did you set the scriptpath correctly? It must contain the directory where your send_nsca binary can be found.touch /tmp/check_logfiles.trace tail -f /tmp/check_logfiles.trace
[Reply]
Martin Baddie Reply:
March 26th, 2010 at 14:10@lausser, I found the problem. In your examples at “Example 3: Again, but this time with a notification for each single hit” you have forgotten to mention to put
options => 'script,protocol,nocount'line to @searches so no send_nsca was sent using send_nsca. Please correct http://labs.consol.de/nagios/check_logfiles/check_logfiles-beispielecheck_logfiles-examples/ so everyone can benefit .
Regards.
[Reply]
lausser Reply:
March 26th, 2010 at 18:57Your right. Thanks a lot for pointing me to this!
-
Benny Says:
March 24th, 2010 at 17:02Hmmmm, almost… I use the double quotes now, like: check_logfiles –type “eventlog:eventlog=application,include,eventtype=error,eventid=9999,options=winwarncrit” and it gives me a default_lines=1 (so it seems to have matched my test 9999 event), but the output is “OK – no errors or warnings”. I’ve also tried it with criticalpatterns=.* appended, no change. Oooooooh, I’m so close to getting this working!
[Reply]
lausser Reply:
March 24th, 2010 at 19:18Very close :-)
check_logfiles \ --type "eventlog:eventlog=application,include,eventtype=error,eventid=999" \ --winwarncrit
[Reply]
-
Mike Says:
March 24th, 2010 at 17:27Hi all
I’m trying to set up a config for monitoring the Windows system log and so far I have it working
but I’d like to set it to ignore errors with a specific text string and I’m having trouble getting the syntax correct
would this example be a way around it?
@searches = ( { tag => ‘system’, type => ‘eventlog’, eventlog => { eventlog => ‘system’, eventtype => ‘error,warning’, criticalexception=> ‘SomeText’ }, }, }, );
[Reply]
lausser Reply:
March 24th, 2010 at 19:10be careful. it’s criticalexception (singular) when used as a command line parameter, but it’s criticalexceptions (plural) when used in the config file.
[Reply]
Mike Reply:
March 25th, 2010 at 10:41ah thanks that may explain why it didn’t work before
I’ll set up the config
@searches = ( { tag => ’system’, type => ‘eventlog’, eventlog => { eventlog => ’system’, eventtype => ‘error,warning’, criticalexceptions=> ‘SomeText’ }, }, }, );
and see how that works
[Reply]
Mike Reply:
March 25th, 2010 at 18:41been having no luck can anyone help?
all I want to do is create a config that will check the windows system eventlog and notify for all warnings or errors conditions (using winwarncrit) except for errors which have a specifed text string
I’ve tried all sorts of settings and either winwarncrit overrides any criticalexceptions strings I use or real errors don’t get picked up
there is a pint in it for the first correct answer
[Reply]
lausser Reply:
March 26th, 2010 at 0:05@searches = ( { tag => ’system’, type => ‘eventlog’, eventlog => { eventlog => ’system’, eventtype => ‘error,warning’, }, criticalexceptions=> 'SomeText', });[Reply]
-
lausser Says:
March 26th, 2010 at 0:00This won’t work. Please don’t mix criticalexceptions with eventlog. criticalexceptions do not belong inside this hash.
[Reply]
-
Benny Says:
March 26th, 2010 at 20:06Just a quick comment on this page – in the section talking about oraclealertlog, you have what is intended to be a link to a script (I think), that has empty anchors around it. Probably not intentional?
Benny
[Reply]
-
Mike Says:
March 29th, 2010 at 10:26hi all
just a quick question if I want to specify more then 1 criticalexception what would be the format in a config file
would it be:- 1) criticalexceptions=> ‘Error text’, ‘Error text2′,
or
2) criticalexceptions=> ‘Error text’, criticalexceptions=> ‘Error text2′,
or is there another way?
cheers
Mike
[Reply]
-
ledskof Says:
March 31st, 2010 at 21:27I don’t see how to get allyoucaneat to work. I delete the seek file and it just CRITICALS again:
$seekfilesdir = ‘c:\temp’;
$MACROS = { LOGDIR => ‘C:\temp’ };
@searches = ({ tag => ‘test.log’, type => ‘rotating’, logfile => ‘$LOGDIR$\test.log’, rotation => “test.log\\d{8}”, options => ‘noprotocol,allyoucaneat’, criticalpatterns => ‘!20′, });
[Reply]
-
Ray Says:
April 13th, 2010 at 15:32On windows, I am calling this config:
@searches = ({ tag => ‘InternalServerError’, logfile => ‘C:\tianshan\logs\rtspproxy.log’, criticalpatterns => [ "500 Internal Server" ] });
C:\ProgramFiles\NSClient++\scripts\check_logfiles3.2>check_logfiles.exe –config check_streamsmith.cfg OK – no errors or warnings|InternalServerError_lines=0 InternalServerError_warnings=0 InternalServerError_criticals=0 Inter nalServerError_unknowns=0
It returns OK, but if I run a findstr on the log, I get the entries that should be throwing a critical.
findstr /c:”500 Internal Server” c:\tianshan\logs\rtspproxy*
c:\tianshan\logs\RtspProxy.log:03-12 10:22:23.661 [ INFO ] Request processed: session[2060169217] seq[1191] verb[SETUP] duration=[110/110]msec startline [RTSP/1.0 500 Internal Server Error] socket(000009bc 10.12.105.88:4349) c:\tianshan\logs\RtspProxy.log:03-12 10:22:23.661 [ DEBUG ] SOCKET: 000009bc 10.12.105.88:4349 RTSP/1.0 500 Internal Serv er Error..CSeq: 1191..Method-Code: SETUP..Notice: RTSP/1.0 500 Internal Server Error..OnDemandSessionId: 2f5c9a130000004080 00000041258762..Server: ssm_NGOD2/1.10..Session: 2060169217..Supported: com.comcast.ngod.r2,com.comcast.ngod.r2.decimal_npt s..Date: 12 Mar 2010 15:22:23.661 GMT…. c:\tianshan\logs\RtspProxy.log:03-12 10:22:25.364 [ INFO ] Request processed: session[2060234754] seq[1192] verb[SETUP] duration=[16/16]msec startline [RTSP/1.0 500 Internal Server Error] socket(000009bc 10.12.105.88:4349) c:\tianshan\logs\RtspProxy.log:03-12 10:22:25.364 [ DEBUG ] SOCKET: 000009bc 10.12.105.88:4349 RTSP/1.0 500 Internal Serv er Error..CSeq: 1192..Method-Code: SETUP..Notice: RTSP/1.0 500 Internal Server Error..OnDemandSessionId: 2f5c9a130000004080 00000041258762..Server: ssm_NGOD2/1.10..Session: 2060234754..Supported: com.comcast.ngod.r2,com.comcast.ngod.r2.decimal_npt s..Date: 12 Mar 2010 15:22:25.364 GMT…. c:\tianshan\logs\RtspProxy.log:03-12 10:22:27.208 [ INFO ] Request processed: session[2060300291] seq[1193] verb[SETUP] duration=[16/16]msec startline [RTSP/1.0 500 Internal Server Error] socket(000009bc 10.12.105.88:4349) c:\tianshan\logs\RtspProxy.log:03-12 10:22:27.208 [ DEBUG ] SOCKET: 000009bc 10.12.105.88:4349 RTSP/1.0 500 Internal Serv er Error..CSeq: 1193..Method-Code: SETUP..Notice: RTSP/1.0 500 Internal Server Error..OnDemandSessionId: 2f5c9a130000004080 00000041258762..Server: ssm_NGOD2/1.10..Session: 2060300291..Supported: com.comcast.ngod.r2,com.comcast.ngod.r2.decimal_npt s..Date: 12 Mar 2010 15:22:27.208 GMT….
[Reply]
lausser Reply:
April 13th, 2010 at 19:06That’s normal behaviour. check_logfiles only scans lines which were added since the last run of check_logfiles. Add a new line to the logfile and you will see.
[Reply]
ray Reply:
April 14th, 2010 at 9:40Confused, so it will never find it in the initial scan? even if I delete the seek files that keep track of where in the file it has looked?
[Reply]
lausser Reply:
April 14th, 2010 at 10:27If you delete the seekfile, check_logfiles will think it’s running for the very first time, so it’ll not scan the entire file but only initialize itself. (set the pointer to the end-of-file and save that position in the seekfile) However, you can force it to start from the beginning of the logfile during the initial run by using the option “allyoucaneat”
@searches = ({ tag => 'InternalServerError', logfile => 'C:\tianshan\logs\rtspproxy.log', criticalpatterns => [ "500 Internal Server" ], options => 'allyoucaneat', });
[Reply]
-
Günter Says:
April 14th, 2010 at 12:03Hello, I try to call check_logfiles with check_mk’s mpre. My problem is that the output of check_logfiles seems to be not the standard nagios output, which is also expected by check_mk. I get the following output: OK – no errors or warnings|OneBaseLogfile_lines=0 OneBaseLogfile_warnings=0 OneBaseLogfile_criticals=0 OneBaseLogfile_unknowns=0 The standard nagios output should be SERVICE STATUS: Information text as you can read at http://nagiosplug.sourceforge.net/developer-guidelines.html#PLUGOUTPUT Is it possible to include the tag infront of the status, like OneBaseLogfile OK – no errors or warnings|OneBaseLogfile_lines=0 OneBaseLogfile_warnings=0 OneBaseLogfile_criticals=0 OneBaseLogfile_unknowns=0 Or did I miss something and there is already an option?
[Reply]
-
Ollie Bridges Says:
April 16th, 2010 at 8:00Hi there,
Is it possible to exit check_logiles after a certain amount of errors (and then move onto the psotscript)? I cannot find a way to access the hitcount anywhere – am I missing something?
[Reply]
lausser Reply:
April 17th, 2010 at 12:05You cannot abort the search. But you can set a counter-variable in the config-file which you increment with the help of a handler script every time a pattern matches. Then you have the number of hits available in the postscript.
[Reply]
-
Pablo Says:
April 21st, 2010 at 13:18Hi there, I think I’m having some problems with the value of the variable “devino” in the tracefiles. As far as I know, this variable lets the script detect the position of the logfile in the filesystem and allows it to search for rotations. The length of these values might vary from tracefile to tracefile, but there are many tracefiles where this value seem to depend on the size of the logfile found or on something else, thus leading to tracefile sizes which vary between 1 and several KBs (even MB sometimes). Is this a normal feature or am I doing something wrong? Thank you!
[Reply]
lausser Reply:
April 21st, 2010 at 17:58devino is composed of the device number (which identifies the filesystem) and the inode number. It is a unique identifier for a file and helps check_logfiles to detect situations where example.log is not the same file example.log during the last run. You should not have tracefiles, except when something is not working correctly. So just delete them.
[Reply]
Pablo Reply:
April 22nd, 2010 at 9:21@lausser, Hi again, first of all, I would like to thank you Lausser for the description of devino. I’m afraid I have misused the word “tracefiles”. I meant the seekfiles, where the script saves the current status (with all these variables like runcount, serviceoutput, thresholdcnt and the devino variable self), I hope this one is the correct word :-) Sorry for the inconvenience and thank you again.
[Reply]
-
Benny Says:
April 21st, 2010 at 22:07Hello all! I just have a quick question about –sticky. I am using check_logfiles to check Windows event logs, and I’m using the sticky flag to require more than one failure before Nagios notifies (this cuts down on nuisance alerts drastically). Is the –sticky “timer” started when check_logfiles first registers a hit on an event ID, or is it when the event was logged? I have had several hits in my event logs that should have tripped notifications but didn’t, and I’m wondering if my assumption that the timer starts when check_logfiles registers the first hit is incorrect. Thank you!
[Reply]
Benny Reply:
April 26th, 2010 at 14:11@Benny, Any clarification on this? If someone could tell me when the timer starts counting for the –sticky option, I would very much appreciate it!
[Reply]
lausser Reply:
April 26th, 2010 at 17:31Hi, the timer starts with the regular expression match. (the runtime of the plugin).
[Reply]
-
Anatoly Rabkin Says:
April 22nd, 2010 at 14:52Hi,
First of all – thank for this great script, it’s really makes life more easier :).
I have the following question: I need to search for some string and to present not just the line that contains this pattern, but the X lines before and Y lines after that pattern. I know that its possible to do such logic with supersmartpostscript option but I getting some issues here. I don’t want to add this logic to your script or something like this, can you please suggest me how to perform it better?
Thanks in advance
[Reply]
lausser Reply:
April 26th, 2010 at 17:26Sorry, there is no way to display the “surroundings” of a matching line, except implementing it with supersmart scripts.
[Reply]
-
Matthias Says:
April 22nd, 2010 at 17:17Hello Lausser,
first of all, thank you very much for this plugin. I use it to monitor nginx (a webserver). Since yesterday, we are getting a lot of overlong uris, and Nagios has real problems with what nrpe/check_logfiles puts out. I tried to set a maxlength, but this does not make the output shorter. check_logfiles does read my config file (I put ‘noperfdata in there, and it stopped putting that in afterwards).
Here is my config
@searches = ( { tag => ‘nginx errors’, logfile => ‘/data/log/nginx/error_log’, options => ‘noperfdata,maxlength=50′, criticalpatterns => ‘[error]‘, criticalexceptions => ['prematurely','http:/tag','client sent invalid userid','keepalive'], } );
and here is what the output looks like:
nagios@ccp3 /var/run $ /usr/lib64/nagios/plugins/check_logfiles –config /usr/lib64//nagios/plugins/check_logfiles.cfg CRITICAL – (4 errors in check_logfiles.protocol-2010-04-22-10-10-53) – 2010/04/22 10:10:49 [info] 3745#0: *22630386 client sent too long URI while reading client request line, client: 64.106.215.72, server: ccp3, request: “GET /am_bidder?admeld_publisher_id=221&admeld_request_id=e6059968-ccb9-42c2-81da-d9e8499cab93&admeld_tag_id=259056&admeld_user_id=304a8a05-3ca3-4a29-b3c4-96ecc6b98a9a&admeld_website_id=541&external_user_id=C3D0C0AD5F85BB4BB8454457023F7004&ip_address=98.229.46.144&language=en-us&max_response_time=150&position=below&refer_url=http%3a%2f%2ftag.admeld.com%2fad%2fiframe%2f221%2ftmz%2f300x250%2faf-bottom-right%3ft%3d1271949048496%26tz%3d240%26hu%3d%26ht%3djs%26hp%3d0%26url%3dhttp%253A%252F%252Fwww.tmz.com%252Fa0e4cc1a-08e3-42ec-bbba-4e3447d7e890%253Fd757bd5d029f4634864ef694fcbbf9d8%252F3f2a29b915b64a509188eacff137fe43d757bd5d029f4634864ef694fcbbf9d8.js%253Fspd%253D2%2526atdmt%253D%2526a4eclickmacro%253Dhttp%25253A%25252F%25252Fg.va.bid.invitemedia.com%25252Fpixel%25253FreturnType%25253Dredirect%252526key%25253DClick%252526message%25253D%2525257B%25252522nhpgvbaVQ%25252522%2525253A%25252B%25252522n0r4pp1n-08r3-42rp-ooon-4r3447q7r890%25252522%2525252C%25252B%25252522havirefny_fvgr%25252522%2525253A%25252B5702%2525252C%25252B%25252522fhoVQ%25252522%2525253A%25252Bahyy%2525252C%25252B%25252522yvarvgrzVQ%25252522%2525253A%25252B97022%2525252C%25252B%25252522cho_yvarvgrz%25252522%2525253A%25252B29822%2525252C%25252B%25252522vai_fvmr%25252522%2525253A%25252B70074%2525252C%25252B%25252522mvc_pbqr%25252522%2525253A%25252B%2525252201841%25252522%2525257D%252526redirectURL%25253Da4edelim%2526a4ehtm%253Da0e4cc1a-08e3-42ec-bbba-4e3447d7e890a4edelima4eflag%2526fn%253Da4edelim%2526imgSrv%253DHTTP%253A%252F%252Frmd.atdmt.com%252Ftl%252FO6SOHINVEINV%252Fa4edelim%2526armver%253Difb.9%26refer%3dhttp%253A%252F%252Ftag.admeld.com%252Fad%252Fiframe%252F221%252Ftmz%252F300x250%252Fbf-bottom-right%253Ft%253D1271949043010%2526tz%253D240%2526hu%253D%2526ht%253Djs%2526hp%253D0%2526url%253Dhttp%25253A%25252F%25252Fwww.tmz.com%25252F%2526refer%253D&size=300×250&time_zone=240&url=http%3a%2f%2fwww.t …
any idea why no cutoff happens there?
Thanks,
Matthias
[Reply]
lausser Reply:
April 27th, 2010 at 1:48My fault. Maxlength seems to be ignored in the last release(s). I’ll fix it. A new version 3.3 will come soon.
[Reply]
-
Max Says:
April 27th, 2010 at 16:22Hi Lausser,
I have logfiles that are rotated in the following format: AssetServer.log, AssetServer.log.2010-04-26,
How can I specify this kind of format in the rotation parameter? I
[Reply]
lausser Reply:
April 27th, 2010 at 16:29Hi, this should do the trick:
... logfile => '..../path/.../AssetServer.log', rotation => 'AssetServer\.log\.\d{4}\-\d{2}\-\d{2}', ...[Reply]
-
Max Says:
April 30th, 2010 at 15:49Lausser,
Sometimes I dont get the line in the logfile that got flagged by check_logfiles in the Nagios email.
Example: Date/Time: Fri Apr 30 09:14:07 EDT 2010
CRITICAL – (1 errors) – 09:13:55:151
Additional Info:
tag AssetServer CRITICAL 09:13:55:151
The actual line that was flagged was:
09:13:55:151|0226-TABLE {SYS_R_LAST_SYSERR} ACTION {DEL} DWL {0} – {Source CREDIT_BBG_OTF} {Component CREDIT_BBG_OTF} {Daemon MKV_DS_CREDIT} {ErrorLevel 3} {ErrorType 8} {Date 20100430} {Time 9134600} {Error STATUS Disconnected} {SeqId 377434}
Is there something in this line that is preventing Nagios/check_logfiles from sending it in the email? It looks like maybe it does not like the “|” symbol ?
[Reply]
-
Michael Says:
May 3rd, 2010 at 16:58Hi,
it seems there is a problem when a Windows eventlog branch does not exist. We try to place an identical basic cfg-file template for check_logfiles on all our servers and we configured searches for all possible event sources (System, Application, Security, Powershell, and so on). If for example there is no powershell installed on a system, this eventlog branch does not exist. Now the warningexceptions no longer work and all warning events are reported regardless wether they are excluded by the filter or not.
[Reply]
lausser Reply:
May 10th, 2010 at 0:10Please post your configuration file. If an eventlog branch does not exist and you have a …eventlog=
configured, you normally get an error. With the option “nologfilenocry” the missing eventlog is silently ignored. [Reply]
-
haitauer Says:
May 6th, 2010 at 9:19Hi Lausser,
any news on post 25, 26 and 28?
thank you!
[Reply]
-
Xiaoming Says:
May 6th, 2010 at 16:28Hi, can I check that the logfile must changed between the two checks ? If the log unchanged, the concerned process is locked, then a critical event must send.
Thanks
[Reply]
lausser Reply:
May 10th, 2010 at 0:18This will alert when no lies have been added since the last run.@searches = ({ tag => 'xx', logfile => 'test.log', criticalpatterns => '!.*', options => 'nologfilenocry', });
[Reply]
-
Ryan Says:
May 12th, 2010 at 17:42This is an exceptional tool and I thank you for your continued development.
Are you aware of anyone that has developed a conversion tool to take HP OVO logfile templates and convert them to check_logfiles cfgs? If it doesn’t already exist I am assuming I will have to write one because the number of templates I will have to convert is, um, insane.
[Reply]
lausser Reply:
May 12th, 2010 at 19:19Hi, unfortunately i never hear of anybody who migrated this kind of templates to check_logfiles
I never worked with OVO myself, but i’d like to see how such a template looks like. Can you mail me an example please?
[Reply]
-
haitauer Says:
May 18th, 2010 at 15:31Hi Lausser,
hmm, any news on post 25, 26 and 28?
thank you!
[Reply]
-
Benny Says:
May 25th, 2010 at 14:59–report=long & –maxlength seem to cancel each other out?
I am testing a Windows 2008 server, and while testing some event log stuff, I started getting errors from NSClient++ because the output was too long.
I started experimenting with –maxlength, and it didn’t clear up the error untli I removed –report=long from the command.
Is this intended behavior? I see a lot of examples above of using –maxlength and –report=long together…
Thank you!
[Reply]
lausser Reply:
May 25th, 2010 at 23:42Thats a problem with nsclient++ with long/multiple lines
[Reply]
-
René Says:
May 25th, 2010 at 16:32Hallo Herr Lausser,
Gibt es eine Möglichkeit mit check_logfiles nicht einen counter der gefundenen Zeilen des Logs auszugeben, sondern für jede einzelne gefundene Zeile eine Ausgabe an das Nagios sendet?
Das Ziel wäre es, für jede einzeln gefunden Zeile, einen Alarm zu generieren.
[Reply]
lausser Reply:
May 25th, 2010 at 23:34http://labs.consol.de/nagios/check_logfiles/check_logfiles-beispielecheck_logfiles-examples/ Beispiel 3. Hinter dem Key script kann eine beliebige Perl-Funktion stehen. Entweder man macht es so, wie im Beispiel oder man programmiert in dem Script seine eigene Methode zum Versand des Treffers.
... script => sub { my $trefferzeile = $ENV{CHECK_LOGFILES_SERVICEOUTPUT}; # man kann alles mögliche mit $trefferzeile anstellen # z.b. mit send_nsca versenden # oder in eine Datei schreiben # oder mit einem x-beliebigen Script z.b. an HP Openview schicken.... return 0; # nach der Treffer-Verarbeitung nicht weiter beachten }, ...
[Reply]
lausser Reply:
May 25th, 2010 at 23:40I think, your Oracle tool just looks at used space vs. allocated space. Now if your data grow, the database automatically allocates more space and the percentage drops. (for example, it approaches 95%, then space is allocated and the percentage drops to 90%. This might lead to unnecessary alerts, because the db handles the “error” automatically). check_oracle_health takes the maximum allocatable space into account, thats why you usually get far less percentages.
[Reply]
-
Micha Bloch Says:
May 27th, 2010 at 16:21Hi many thanks for the plugin :)
I have a little problem with the plugin. The problem is, that the Plugin always said the Logfiles looks good, but they don´t looked good. When i try
./check_logfiles -t 30 –logfile=/var/log/server/mail/error-mail.log –warningpattern=’ldap’
he pulls out:
OK – no errors or warnings|default_lines=0 default_warnings=0 default_criticals=0 default_unknowns=0
i don´t really understand this :/. When i try it with my config i get the same message:
/usr/lib/nagios/plugins/check_logfiles -f checklog.cfg
OK – no errors or warnings|Mailserver_lines=102 Mailserver_warnings=0 Mailserver_criticals=0 Mailserver_unknowns=0
Configfile:
$seekfilesdir=’/var/log/server’; $protocolsdir=’/var/log/server’;
@searches = ( { tag => ‘Mailserver’, logfile => ‘/var/log/server/mail/error-mail.log’, archive => ‘/Var/log/server/mail/archive/’, rotation => ‘LOGLOGDATE8′, options => ‘allyoucaneat’, criticalpattern => ‘ldap’ } )
I use a syslog server wich is also installed on the Nagios Server. Rsyslog put every message via the severity in an another file.
i hope you can help me :)
[Reply]
lausser Reply:
May 27th, 2010 at 19:11Be careful: It must be criticalpatterns (plural) in the configfile.
[Reply]
Micha Bloch Reply:
May 28th, 2010 at 9:13@lausser, oh man i worked to long yesterday -.-°
Thank you now it works.:)
Last question…. check_logfiles should read my logrotated files as well, but i don´t know the right decleration for the rotation option. My logrotated files have the name name.of.the.server.log-20100525
Maybe you can help me again :)
Thx a lot
[Reply]
-
IT-COW | Icinga - erweiterte Konfiguration *UPDATE* Says:
June 1st, 2010 at 5:07[...] nächstes wird darauf aufbauend das PlugIn check_logfiles benötigt, auf jeden Fall für den Windows-Server – der Link enthält auch direkt eine [...]
-
haitauer Says:
June 2nd, 2010 at 10:01Hi Lausser,
are you blind?? / bist Du blind??
Ignoring questions again and again is not nice!
:-(
[Reply]
-
Frank Says:
June 7th, 2010 at 17:59Hello Gerhard,
I have the problem that we are scanning various logs on application servers which grow quite large during the day (rolling over some time during the night). For now we are checking the logs for certain strings every 5 minutes. Now we have come to a point that the checks start stacking as the period of time of minutes is not long enough to parse the logs. Therefor we see the load of the system increase steadily since the checks are waiting for each other. Before we start writing a wrapper to check, as the process starts, if there is another process still running, I was wondering if you or anyone else reading this, made the same experience and maybe already has a solution at hand.
Thanks for any hint!
Cheers Frank
[Reply]
lausser Reply:
June 10th, 2010 at 1:12I found your post in the spam folder :-) The size of a logfile isn’t a problem. It will not be scanned entirely, only the portion which was added since the last run of check_logfiles. Do your files really grow so fast in 5 minutes? Do you have lots of patterns? If it’s really impossible to keep up within a check_interval, you might try the daemon mode and run check_logfiles independent from Nagios.
With the daemon-parameter, check_logfiles puts itself in the background and starts a search every 5 minutes (which is the default. You can change it, interval is the number of seconds to sleep between each run) You can stop the damon with SIGTERM. But: in this standalone mode you must take care to send the checkresult back to Nagios. Have a look at the examples, there is a configuration which uses send_nsca to report every hitcheck_logfiles --config <cfgfile> --daemon [interval]
[Reply]
Frank Reply:
June 14th, 2010 at 17:03@lausser, good you found it! :) And thanks for your reply! Well, for now there are 6 application servers behind a loadbalancer and each app-server writes a log which at the end of the day has a size of 6-10GB for the application only. Not sure if you consider that “large” ;) The patterns to search for on those app-servers are not that many, but apart from the app-logs there are a couple of others which add to the amount of time the check runs. So overall – and yes, I need to dig deeper – I assume that the processes I see and that at one point actually prevented the server from keeping up the service(!!) which really hurt – are processes that got stuck from previous runs. I might try that daemon version but then I have to get the NSCA up on those servers as well to get the results back to the Nagios server… I will have an eye on the duration first and the try the daemon mode.
Thanks again for ALL the plugins you have provided :)
[Reply]
lausser Reply:
June 14th, 2010 at 18:0610GB at the end of the day is not large, but the 37MB every 5 minutes are :-) Depending on your hardware and processes running at the same time you might have hit a limit here. I tried it on a weak testmachine (1GHz Atom)
The processor is not really powerful and at least two of the regexps are not trivial, but 1m19 with 100% cpu means some load. I know people who are running logfile checks with such big amounts of data, but on pure syslog servers. The picture changes when you add that load to a production machine which has the priority to provide a service. So packing all the checks in one @searches-array and running check_logfiles in daemon mode (maybe with a lowered priority) should be the best alternative. Unfortunately i see no performance tuning potential any more. I already profiled and tweaked the perl code and ther regexp routines to a max.shinken$ ls -l maillog -rw-rw-r-- 1 shinken shinken 36266022 Jun 14 17:38 maillog shinken$ cat cfg.cfg @searches = ({ logfile => 'maillog', criticalpatterns => ['woot', 'w00t', 'error', 'FATAL', '\d+\s+\d+\s+timestamp', 'he?a?d.?[ -]?(ache)', 'na?u?a?se?a?'], }); shinken$ time check_logfiles --config cfg.cfg CRITICAL - (328266 errors in cfg.protocol-2010-06-14-17-40-04) - Jun 3 22:00:33 schinken sendmail[2762]: accepting connections again for daemon MTA ...|default_lines=417825 default_warnings=0 default_criticals=328266 default_unknowns=0</p> <p>real 1m19.646s user 1m18.920s sys 0m0.715s[Reply]
-
Joe Says:
June 16th, 2010 at 15:09Hi Lausser,
at first thank you for your great plug-in and support.
I have logfiles that with the beginning of a new day are started with a new file. They are named in the following format: logfileYYYY_MM_DD.log e. g. logfile2010_06_16.log.
There are criticalpatterns defined in the conf that should be sticky. Each night with the beginning of a new logfile a new seekfile is written with no sticky error from last run (see excerpt from tracefile) and the error disappears in Nagios. Is there a possibility to keep the sticky information?
Thanks in advance.
/etc/nagios/cl.conf: @searches = ( { tag => ‘test’, logfile => ‘/var/log/logfile$CL_DATE_YYYY$$CL_DATE_MM$$CL_DATE_DD$.log’, rotation => ‘logfile\d{4}_\d{2}_\d{2}\.log’, criticalpatterns => ‘.CRITICAL.‘, options => ‘nologfilenocry,sticky=85400,noprotocol’, } )
/tmp/check_logfiles.trace: Tue Jun 15 23:58:24 2010: ==================== /var/log/logfile2010_06_15.log ================== Tue Jun 15 23:58:24 2010: found seekfile /var/tmp/check_logfiles_test._var_log_logfile2010_06_15.log.test Tue Jun 15 23:58:24 2010: LS lastlogfile = /var/log/logfile2010_06_15.log Tue Jun 15 23:58:24 2010: LS lastoffset = 11983936 / lasttime = 1276638778 (Tue Jun 15 23:52:58 2010) / inode = 26630:560640 Tue Jun 15 23:58:24 2010: the logfile grew to 12024996 Tue Jun 15 23:58:24 2010: opened logfile /var/log/logfile2010_06_15.log Tue Jun 15 23:58:24 2010: logfile /var/log/logfile2010_06_15.log (modified Tue Jun 15 23:57:59 2010 / accessed Tue Jun 15 23:53:24 2010 / inode 560640 / inode changed Tue Jun 15 23:57:59 2010) Tue Jun 15 23:58:24 2010: first relevant files: logfile2010_06_15.log Tue Jun 15 23:58:24 2010: /var/log/logfile2010_06_15.log has fingerprint 26630:560640:12024996 Tue Jun 15 23:58:24 2010: relevant files: logfile2010_06_15.log Tue Jun 15 23:58:24 2010: moving to position 11983936 in /var/log/logfile2010_06_15.log Tue Jun 15 23:58:24 2010: stopped reading at position 12024996 Tue Jun 15 23:58:24 2010: an error level of 2 is sticking at me Tue Jun 15 23:58:24 2010: stay sticky until Wed Jun 16 09:59:45 2010 Tue Jun 15 23:58:24 2010: keeping position 12024996 and time 1276639079 (Tue Jun 15 23:57:59 2010) for inode 26630:560640 in mind Wed Jun 16 00:03:24 2010: ==================== /var/log/logfile2010_06_16.log ================== Wed Jun 16 00:03:24 2010: try seekfile /var/tmp/check_logfiles_test.logfile2010_06_16.log.test instead Wed Jun 16 00:03:24 2010: no seekfile /var/tmp/check_logfiles_test._var_log_logfile2010_06_16.log.test found Wed Jun 16 00:03:24 2010: but logfile /var/log/logfile2010_06_16.log found Wed Jun 16 00:03:24 2010: ILS lastlogfile = /var/log/logfile2010_06_16.log Wed Jun 16 00:03:24 2010: ILS lastoffset = 28742 / lasttime = 1276639380 (Wed Jun 16 00:03:00 2010) / inode = 26630:560660 Wed Jun 16 00:03:24 2010: the logfile did not change Wed Jun 16 00:03:24 2010: nothing to do Wed Jun 16 00:03:24 2010: keeping 0 Wed Jun 16 00:03:24 2010: no sticky error from last run Wed Jun 16 00:03:24 2010: keeping position 28742 and time 1276639380 (Wed Jun 16 00:03:00 2010) for inode 26630:560660 in mind
[Reply]
lausser Reply:
June 16th, 2010 at 16:22Use type rotating::uniform when current logfile and archived logfiles use the same naming.
... type => 'rotating::uniform', logfile => '/var/log/dummy', rotation => 'logfile\d{4}\-\d{2}\-\d{2}.log', ...[Reply]
Joe Reply:
June 17th, 2010 at 13:40@lausser, Hello Lausser,
thanks for your quick reply. If I use the following conf
@searches = ( { tag => ‘test’, type => ‘rotating::uniform’, logfile => ‘/var/log/dummy’, rotation => ‘logfile\d{4}_\d{2}_\d{2}\.log’, criticalpatterns => ‘.CRITICAL.‘, options => ‘sticky=85400,noprotocol’, } )
I get “cannot create rotating::uniform search test”. On another server where I adjusted the confs there was no such problem. Its not an issue with permissions – I tried as root. Do you have any hints? Thanks in advance. Joe
[Reply]
-
Joe Says:
June 17th, 2010 at 15:05Thanks for your reply, but there is no syntax error in the conf file. Do you have any other hint?
[Reply]
-
Gerhard P Says:
June 24th, 2010 at 14:32Hallo Gerhard,
Thanks for the Check … simply perfect!
i have an issue with an Win2k3 Enterprise Edition 32Bit, i have there check_logfiles version 3.4.1. When checking an log file ~42MB large it shows: $state = { ‘runcount’ => 15, ‘serviceoutput’ => ”, ‘thresholdcnt’ => {}, ‘logoffset’ => 42020840, ‘privatestate’ => { ‘runcount’ => 15, ‘lastruntime’ => 1277381367, ‘logfile’ => ‘E:\\logs\\FILE.log’ }, ‘devino’ => ‘fffe320031002e00300036002e0032003000310030002000310038003a00300030003a00330035003a003a0033003800300037003a003a0049004e0046004f003a003a002a002a002a0020005300740061007200740020004f00720067005000750062006c00690073006800650072002000730063007200690070007400200020002a002a002a000d000a’, ‘runtime’ => 1277381969, ‘logtime’ => 1277136035, ‘servicestateid’ => 0, ‘tag’ => ‘FILE’, ‘logfile’ => ‘E:\\logs\\FILE.log’ };
1;
the ‘logoffset’ is allways 42020840… is this an OS limit? Problem is it cannot find the ERROR….
Other checks on the same Box (logfiles are smaler) are working perfect.
the configfile:
$seekfilesdir=’C:\nagios’; $protocolsdir=’C:\nagios’; @searches = ( { tag => ‘FILE’, type => ‘simple’, logfile => ‘E:\logs\FILE.log’, criticalpatterns => ‘ERROR’, options => ‘protocol’, }, );
[Reply]
lausser Reply:
June 24th, 2010 at 14:47When you add a dummy error with
does check_logfiles end with a critical? And if logoffset is still at 42020840 (which is too small to be a problem with 32bit), do at least logtime and runtime change? You can have a deeper look at the inner workings by adding the following line:ECHO dummyERRORdummy >> E:\logs\FILE.log
After you run the plugin you will find lots of details in it.$tracefile = 'C:\TEMP\check_logfiles_FILE.trace';
[Reply]
-
Gerhard P Says:
June 24th, 2010 at 18:08Hallo Gerhard,
thanks for tip with the tracefile … i reduce the file size and now it works… i need to make additional test with large files an see what i can see in the trace. But logtime and runtime are changing…
[Reply]
Gerhard P Reply:
June 25th, 2010 at 17:27@Gerhard P, I found the Problem … encoding=ucs-2… now it works perfect.
Thanks Gerhard
[Reply]
-
Louis G Says:
June 25th, 2010 at 15:37Hello Gerhard,
We use check_logfiles to check alert logs of several Oracle DBs, with one command run and one config file for each DB. I define the SID using $MACROS$ within the config file :
$MACROS$ = { CL_ORASID => “xxxx” };
This works fine. But the -macro option should be a better way to do this, just i have no idea how to use it. Could you provide an example ? Thanks
[Reply]
lausser Reply:
June 25th, 2010 at 15:55You might try this approach: http://www.nagios-portal.org/wbb/index.php?page=Thread&postID=70498#post70498 Use the configuration from the first code-box (template instead of tag and $CL_TAG$ in the logfile name). Then call the plugin as usual but with –tag ORACLESID
[Reply]
-
IT-COW | Icinga - erweiterte Konfiguration Says:
June 26th, 2010 at 16:52[...] nächstes wird darauf aufbauend das PlugIn check_logfiles benötigt, auf jeden Fall für den Windows-Server – der Link enthält auch direkt eine [...]
-
Tina D Says:
June 30th, 2010 at 16:14I’ve just started experimenting with check_logfiles for Windows Event Log. It’s way more powerful than what I’ve been using so far :) However I’ve run into a bit of a problem. When multiple errors are found, only one error is printed. Is there a way to print all errors? This is my config file:
@searches = ({ tag => ‘crit’, type => ‘eventlog’, options => ‘eventlogformat=”EventID %i: (%w%) %s”,maxlength=1024,allyoucaneat’, eventlog => { eventlog => ‘application’, include => { eventtype => ‘error’, }, }, criticalpatterns => ‘.*’, })
BR Tina
[Reply]
lausser Reply:
June 30th, 2010 at 16:29Use the global option report by adding
to the configfile. This will output additional lines with the single hits. report=html is also possible if you like colors. But as it generates html-code this makes only sense if you look at the output in “service details”. Using it in the text of a notification mail (or sms) for example makes it possibly unreadable.$options = 'report=long';
[Reply]
-
Louis G Says:
June 30th, 2010 at 17:15Using $ENV{ORACLE_SID} as explained in
http://www.nagios-portal.org/wbb/index.php?page=Thread&postID=70498#post70498
permits me to solve the problem, that is to have a generic check of alert logs whatever the DB.
Thanks.
Louis
[Reply]
-
Abhinav Gupta Says:
July 1st, 2010 at 10:45Is there any way growth of a log file can be checked by check_logfiles? Say, throw CRITICAL if log file is not growing.
Thanks for help. Abhinav
[Reply]
lausser Reply:
July 1st, 2010 at 11:02You might try to set a negative pattern.
check_logfiles --tag nogrow --criticalpattern '!.' --logfile /var/adm/messages
which means, if . was NOT found, then get critical. So it would get critical every time there were no new lines in the logfile. For example, if you configure it with “max_attempts 5, is_volatile 0, check_interval 1, retry_interval 1″, then you should get an alarm when the logfile didn’t grow during the last 5 minutes.[Reply]
-
Jan Schampera Says:
July 8th, 2010 at 10:38Hi!
Is there a way to pass the logfile as parameter to check_logfiles in a way, I can scan multiple logfiles with no standardized location using a template? Specifying $CL_LOGFILE$ for logfile in the config doesn’t work to catch –logfile, obvisually.
[Reply]
lausser Reply:
July 8th, 2010 at 12:48With the newest release try:
and then... template => 'test', logfile => '$CL_TAG$', criticalpatterns ....
check_logfiles --config the_above_configfile --tag full_pathname_of_logfile
[Reply]
-
Hamza Maal Says:
July 8th, 2010 at 15:28Hi.
Nice little tool. I seem to be having a problem matching singlepatterns for ORA- errors. The log always seems to say everything is all OK when I know there are errors. I am doingthe ff:
criticalpatterns => ‘ORA-3136′
which I can see in the log but does not pick up.
After that how would I apply this for multiple ORA-[3136|3136] type of patterns
[Reply]
lausser Reply:
July 8th, 2010 at 22:37check_logfiles only finds new error messages (which were added to the logfile since the plugin ran last time). In your output you find the performance data xxx_lines=0, which means: no lines were scanned at all. Either you wait until there are new ORA-messages or you manually add one with “echo ORA-3136-test >> logfile”
criticalpatterns can be an array of patterns like in example17 of http://labs.consol.de/nagios/check_logfiles/check_logfiles-beispielecheck_logfiles-examples/
[Reply]
Hamza Maal Reply:
July 9th, 2010 at 8:53@lausser, Hi
OK, so I have added in an ORA code in the bottom of the log and it works fine, however how do I get it to scan through the entire log file the first time on a machine. I have already cleared out the state file in /var/tmp/clear_logs.
[Reply]
lausser Reply:
July 9th, 2010 at 10:50The very first run is always an initialization run, where check_logfiles positions at the end-of-file (and starts reading from this position when it is run next time). Removing the seekfile only makes check_logfiles think, that it has never run before -> init again. If you want to scan the entire file during the initialization run (including error messages which are very very old), use the option allyoucaneat.
.... criticalpatterns => ['ORA..... options => 'allyoucaneat', ....
[Reply]
-
Hamza Maal Says:
July 9th, 2010 at 16:01Thanks, I have sorted this out. I have the following config file
@searches = ({ tag => ‘testalert’, logfile => ‘/app/oracle/admin/lpbtest/bdump/alert_db.log’, criticalpatterns => [ 'ORA\-[0-4][0-9][0-9][1-9][^\d]‘,# ORA-0440 – ORA-0485 background process failure ], warningpatterns => [ 'ORA\-06501[^\d]‘, # PL/SQL internal error ‘ORA\-0*1140[^\d]‘, # follows WARNING: datafile #20 was not in online backup mode ‘Archival stopped, error occurred. Will continue retrying’, ] options => ‘report=short’ });
When I try to run I get UNKNOWN – syntax error syntax error at /export/home/nagios/.scripts/neworalog.cfg line 12, near “options”
What am I doing wrong with the options parameter?
[Reply]
lausser Reply:
July 9th, 2010 at 22:03There’s a comma missing.
criticalpatterns => [.... ], options => ....
[Reply]
-
pirx Says:
July 15th, 2010 at 10:20Hi,
I’m having a hard time to figure out how to scan a postgres log file for certain types of messages.
2010-07-12 11:18:09 CEST WARNUNG: Relation »pg_catalog.pg_largeobject« enthält mehr als »max_fsm_pages« Seiten mit nutzbarem freiem Platz
I tried
./check_logfiles –logfile=/var/log/postgresql/postgresql-8.3-main.log –type virtual –criticalpattern “FEHLER”
CRITICAL – (7 errors in check_logfiles.protocol-2010-07-15-10-17-51) – 2010-07-14 17:05:52 CEST FEHLER: Tabelle »temporary« existiert nicht …|postgres_lines=477 postgres_warnings=0 postgres_criticals=7 postgres_unknowns=0
But for each run a new status file in /tmp is created:
-rw-r–r– 1 root root 571 15. Jul 10:10 check_logfiles.protocol-2010-07-15-10-10-34 -rw-r–r– 1 root root 571 15. Jul 10:10 check_logfiles.protocol-2010-07-15-10-10-35 -rw-r–r– 1 root root 571 15. Jul 10:10 check_logfiles.protocol-2010-07-15-10-10-36 -rw-r–r– 1 root root 571 15. Jul 10:11 check_logfiles.protocol-2010-07-15-10-11-05 -rw-r–r– 1 root root 571 15. Jul 10:11 check_logfiles.protocol-2010-07-15-10-11-06 -rw-r–r– 1 root root 571 15. Jul 10:17 check_logfiles.protocol-2010-07-15-10-17-51 -rw-r–r– 1 root root 1142 15. Jul 10:18 check_logfiles.protocol-2010-07-15-10-18-04
Any ideas?
[Reply]
lausser Reply:
July 15th, 2010 at 10:29These are protocolfiles, not statusfiles. Their purpose is to show the admin all the error messages in one file. This way you don’t have to browse through the logfile and find the single hits. If you don’t want them, use –noprotocol (or options => ‘noprotocol’ in a config file)
[Reply]
pirx Reply:
July 15th, 2010 at 11:04hm, I’m not sure if I was clear in my first message.
If I use the check command like above, it generates a CRITICAL warning in each run.
<
p> ./check_logfiles –logfile=/var/log/postgresql/postgresql-8.3-main.log –type virtual –criticalpattern “FEHLER” –tag=postgres –noprotocol
<
p> CRITICAL – (7 errors) – 2010-07-14 17:05:52 CEST FEHLER: Tabelle »temporary« existiert nicht …|postgres_lines=479 postgres_warnings=0 postgres_criticals=7 postgres_unknowns=0
<
p>I thought the protocol file would log the already catched events. So my question is a.) do I use the plugin in the right way to search for the critical pattern, because the postgres log file is not in the same format as the syslog. And b.) why does it create a new protocol file with each run?
[Reply]
lausser Reply:
July 15th, 2010 at 11:14Of course you get a CRITICAL in each run, because you use the –virtual option, which means “scan the logfile always from the beginning”. The format (postgres, syslog) doesn’t matter at all. If you leave –virtual away, you’ll get a CRTITICAL only if new lines with FEHLER appeared in the logfile since the last run.
[Reply]
pirx Reply:
July 15th, 2010 at 12:31Thank you for your very fast replys!
Ok, virtual is the problem. But without this option no event is detected at all when searching for FEHLER or HINWEIS as critical pattern.
2010-07-13 08:37:03 CEST HINWEIS: Anzahl der benötigten Page-Slots (2469136) überschreitet max_fsm_pages (204800)
./check_logfiles –logfile=/var/log/postgresql/postgresql-8.3-main.log –criticalpattern HINWEIS OK – no errors or warnings|default_lines=0 default_warnings=0 default_criticals=0 default_unknowns=0
Thus my question if I use the command the right way to detect this kind of events in the postgres log. I’m sure I’m missing something obvious…
[Reply]
lausser Reply:
July 15th, 2010 at 12:33check_logfiles shows _____new______ error messages which were appended since the last run. Please read the documentation.
-
Ledskof Says:
July 16th, 2010 at 20:20if (matches < 50) then error Is there a quick way to do this, or does it require a supersmartscript and a line counter?
[Reply]
lausser Reply:
July 16th, 2010 at 20:37No. There is an option (warning|critical)threshold, but only for (matches > 50). You need a script which increments a counter on each match and a supersmartpostscript which finally looks at the sum. Something like that:
my $counter = 0; @searches = ({ ... options => 'script', script => sub { $counter++; }, ... }); $options = 'supersmartpostscript'; $postscript = sub { if ($counter < 50) { printf "CRITICAL - under 50\n"; return 2; } else { printf "OK - more than 50\n"; return 0; } };
[Reply]
-
Gilles Says:
July 22nd, 2010 at 13:32Your plugin worked perfectly, many thanks for your job . Just for tuning, with regular expression how can i consider a criticalpattern only with the combination of 2 alerts code ? For example :
criticalpatterns => [ ‘ERROR1′ and ‘ERROR2′, # Combination of error code 1 and 2
it’s correct ? Thanks Thanks
[Reply]
lausser Reply:
July 22nd, 2010 at 14:59No, ‘and’ is not possible here. criticalpatterns is an array (a list) of comma-separated strings which represent regular expressions. I am not sure what’s your intention. Is it ‘ERROR1 and ERROR2 in one line”? Or is it “only of both ERRORS were found during one run of check_logfiles were found, no matter if they were in one line or in different lines”. Please show me an example or describe it a bit more.
[Reply]
Gilles Reply:
July 22nd, 2010 at 15:55@lausser, ERROR1 and ERROR2 are on different lines during the check_logfile run.
Here an example : 10/07/22 10:01:50 CFTF01E local file [/CFT/CFT_IN/TEMP/xxx] creation error 10/07/22 10:01:50 CFTT82E transfer aborted
The “transfer aborted” error should be critical if associed with ‘creation error’ pratically at the same time
Gilles
[Reply]
lausser Reply:
July 25th, 2010 at 0:12That requires using handlerscripts (option supersmartscript). So after each hit, in the handler script you look at environment $CHECK_LOGFILES_SERVICEOUTPUT if it is ERROR1 and set a flag. If it is ERROR2 and the flag is set, return 2 else return 0.
[Reply]
-
Mariano Says:
July 28th, 2010 at 4:48Hi, I’m trying to setup check_logfiles in a way that if a pattern appears once it reports a Warning. If the same pattern appears more than once before the okpattern, it should report a Critical state. In both cases it should stay on that state until an okpattern is received. I could get this behaviour BUT the problem I’m facing is that the thresholdcnt is not reset every time an okpattern is found. The thresholdcnt resets only when it reaches criticalthreshold. So, in a sequence “PATTERN -> OKPATTERN -> PATTERN” I get “WARNING, OK, CRITICAL” states, when I would expect “WARNING, OK, WARNING”.
Here’s my config:
$MACROS = { LOGFILE => ‘test-$CL_DATE_YYYY$.$CL_DATE_MM$.$CL_DATE_DD$.log’ }; @searches = ({ tag => ‘test’, logfile => ‘$LOGFILE$’, warningpatterns => ‘jdbc’, criticalpatterns => ‘jdbc’, criticalthreshold => 2, okpatterns => ‘ok’, options => ‘sticky’, });
Any clues? Thanks in advance.
[Reply]
lausser Reply:
July 28th, 2010 at 9:30Use the option nosavethresholdcnt. With this setting, counting begins at 0 at every run of the plugin.
[Reply]
-
Mariano Says:
July 28th, 2010 at 15:23Thak you Lausser for your reply. I tried with nosavethresholdcnt but the count is still saved (maybe for sticky option?). Anyway, I don’t need to reset the count at every run, but only when an okpattern is found. I need to keep the previous state (sticky?) until the recovery pattern is found. So, is there a way to make okpattern reset the counter?
[Reply]
lausser Reply:
July 28th, 2010 at 15:29it’s nosavethresholdcount. I thought you would look it up in the documentation.
[Reply]
Mariano Reply:
July 28th, 2010 at 17:07@lausser, OK, sorry, I didn’t notice the typo reading the docs. Maybe I’m not explaining myself right (not native speaker), but I need to keep thresholdcnt to use it with criticalthreshold. It’s just that thresholdcnt is not reset when an okpattern is found. It seems it doesn’t work that way. Thanks for your work and help.
[Reply]
lausser Reply:
July 28th, 2010 at 18:28Yes, the thresholdcounter is not reset, when an okpattern is found. It is reset whenever the number of hits reaches the threshold. There’s the supersmartscript option which allows you to implement any kind of logic. (the config file is just another piece of perl code)
[Reply]
-
Benny Says:
August 4th, 2010 at 15:44Hello!
I was wondering if adding the User field to the available format string options for type evenlog would be possible?
Almost all of my requests for eventlog checks request that the user be included in the alert (for example, the user that initiated an event 7035), and not all events logged by Windows include the username in the event text.
It sure would be nice. :) Thank you for all your hard work on this plugin – it really is fantastic!
Benny
[Reply]
lausser Reply:
August 4th, 2010 at 16:07look here: http://github.com/lausser/check_logfiles and try if the %u works. If you don’t want to get it with git, just copy the file Eventlog.pm (thats where the modifications are) to your existing source tree and run make
[Reply]
-
DAmash Says:
August 6th, 2010 at 8:10Hello, I compiled the plugin for AIX 5.3. On the local machine everything works fine. But in my Nagios Webinterface i get the error
” UNKNOWN – syntax error Insecure dependency in require while running setgid at /usr/local/nagios/libexec/check_logfiles line 900. “
any idea?
DAmash
[Reply]
lausser Reply:
August 18th, 2010 at 14:21I think, that was answered in the nagios-portal.de Something with loading modules belonging to another group.
[Reply]
-
Bridgie Says:
August 9th, 2010 at 18:09Hi there,
After reading all the above posts I noticed that you a couple of your posters have a similar issue to what I am facing.
The problem is that I need to scan a new log files from the beginning and have it pickup a search pattern defined by the criticalpattern, i.e. bypass the initialisation stage
@searches { tag => test1 log file => ‘/tmp/testlogfile.log. criticalpatterns => ['BAD'],
The process of events could be as follows..
a) Check_logfile is called, and it correctly reports that ‘ /tmp/testlogfile.log’ is not found – (now goes back to sleep for 10 mins) b) 5 mins pass and /tmp/testlogfile.log is created by a system process and the the word ‘BAD’ is written out along with some other error message text. c) 5 more minutes pass and check_logfile runs again but fails to pickup the criticalpattern ‘BAD’. d) Thereafter check_logfiles will not pick this up event.
I noted this is default behaviour, but would like to know if there are any workarounds.
The type => virtual will not work for in this case as it will keep re-reading the logfile from the begin each time the check runs
I also see comment on an options => ‘allyoucaneat’ but unable to find any text on what this does
There appears to be options also that can be changed in the statefile (set logtime to 1 etc) which appears to be simular to the virtual option?
I’m sure there is a simple solution to the above, appreciate any help on this one.
Thanks
[Reply]
lausser Reply:
August 9th, 2010 at 20:21The option allyoucaneat is relevant for the very first run (in this case, when testlogfile.log was created). Normally, during the first run, check_logfiles only seeks the end-of-file, saves that position and exits. No scanning of lines is done, because you certainly don’t want to get an alarm caused by a 4-weeks-old error message when you configure a check_logfile-based service. But if you really want to read a logfile from the beginning during the very first run of check_logfiles, then use ‘allyoucaneat’.
[Reply]
-
Bruce Says:
August 23rd, 2010 at 7:49Hi~~ I execute: usr/local/nagios/libexec/check_logfiles –tag=DDB2 –logfile=/mnt/db2/db2diag.log –criticalpattern=”Error”
return: OK – no errors or warnings|smit_lines=0 smit_warnings=0 smit_criticals=0 smit_unknowns=0
But fact ther was lots of error: OK – no errors or warnings|smit_lines=0 smit_warnings=0 smit_criticals=0 smit_unknowns=0 nagios:/mnt/samba$52 cat /mnt/samba/db2diag.log | grep Error | tail 2010-06-24-07.47.54.267438+480 I1579508A437 LEVEL: Error 2010-06-24-09.52.54.383083+480 I1582381A437 LEVEL: Error
Any suggestion is welcome.
[Reply]
lausser Reply:
August 23rd, 2010 at 11:56Read carefully the previous posts. Check_logfiles does not alert on old messages when it is run for the first time. Create a new error message and run it again.
[Reply]
-
Bruce Says:
August 24th, 2010 at 3:23How can I reset check_logfiles(Some files) as first run.
I try to use allyoucaneat, but doc say …when no seekfile exists.
I need to test my sub script, user logger or echo to create new test message everytime is inconvenience.
Is there any option with check_logfiles which I can use to change the setting ?
[Reply]


lausser Reply:
October 13th, 2009 at 10:37
Hi Charles, a config file on the remote side would be the preferred solution. But there is a very, very ugly hack which might help you. It is possible to transform the contents of a config file into a flat, encoded string and use this as the argument instead of the filename. Create a script “encodeconfig” with the following code:
! /usr/bin/perl -w
if (-f $ARGV[0]) { my $contents = do { local (@ARGV, $/) = $ARGV[0]; }; $contents =~ s/([^A-Za-z0-9])/sprintf("%%%02X", ord($1))/seg; printf "%s\n", $contents; } else { printf STDERR "usage: encodeconfig\n";
}
Then create a config file /tmp/clfyprod.cfg
@searches = ({ tag => 'clfyprod', logfile => '/ORACLE/clfyprod/oraadmin/bdump/alert_clfyprod.log', criticalpattern => 'ORA-', criticalexception => 'ORA-(03113|24761)' });Encode this configuration file with:
Now you have an encoded string which contains your configuration. Use this as the argument for the –config parameter.Gerhard
[Reply]