check_hpasm
Posted on July 15th, 2009 by lausser
Description
check_hpasm is a plugin for Nagios which checks the hardware health of Hewlett-Packard Proliant Servers. To accomplish this, you must have installed the hpasm package. The plugin checks the health of
- Processors
- Power supplies
- Memory modules
- Fans
- CPU- and board-temperatures
- Raids (ide and sas only when using SNMP)
and alerts you if one of these components is faulty or operates outside its normal parameters.
Documentation
The plugin can operate in two modes:
- Local. The plugin runs on the server which is to be checked. The command hpasmcli (from the hpasm.rpm package) must be installed.
- Remote. The plugin runs on the Nagios server. It finds out the status of the remote hardware by contacting remote server with SNMP. The hpasm package must be installed on the remote server.
nagios$ check_hpasm OK - hardware working fine nagios$ check_hpasm -H 10.0.73.30 -C public OK - hardware working fine nagios$ check_hpasm -H 10.0.73.30 -C public -P 1 OK - hardware working fine nagios$ check_hpasm -H 10.0.73.30 -C public --snmpwalk /usr/bin/snmpwalk OK - hardware working fine
Comparison of the two modes: lokal und remote.

Verbosity
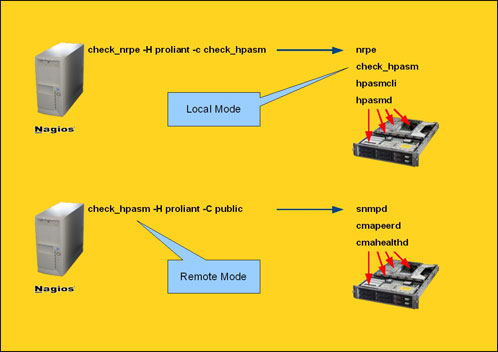
For debugging purposes it can be called with the –verbose (or -v) option. It will then output the detailed status of each checked component:
nagios$ check_hpasm -v CRITICAL - dimm module 0:5 (module 5 @ cartridge 0) needs attention (degraded), System: 'proliant dl360 g5', S/N: '3UH841N09K', ROM: 'P58 08/03/2008' checking cpus cpu 0 is ok cpu 1 is ok checking power supplies powersupply 1 is ok powersupply 2 is ok checking fans fan 1 is present, speed is normal, pctmax is 50%, location is powerSupply, redundance is redundant, partner is 2 fan 2 is present, speed is normal, pctmax is 50%, location is cpu, redundance is redundant, partner is 3 fan 3 is present, speed is normal, pctmax is 50%, location is cpu, redundance is redundant, partner is 1 checking temperatures 1 ioBoard temperature is 42C (65 max) 2 ambient temperature is 18C (40 max) 3 cpu temperature is 30C (95 max) 4 cpu temperature is 30C (95 max) 5 powerSupply temperature is 29C (60 max) checking memory dimm module 0:1 (module 1 @ cartridge 0) is ok dimm module 0:2 (module 2 @ cartridge 0) is ok dimm module 0:3 (module 3 @ cartridge 0) is ok dimm module 0:4 (module 4 @ cartridge 0) is ok dimm module 0:5 (module 5 @ cartridge 0) needs attention (degraded) dimm module 0:6 (module 6 @ cartridge 0) is ok dimm module 0:7 (module 7 @ cartridge 0) is ok dimm module 0:8 (module 8 @ cartridge 0) is ok checking disk subsystem da controller 0 in slot 0 is ok controller accelerator is ok controller accelerator battery is ok logical drive 0:1 is ok (distribDataGuard) physical drive 0:0 is ok physical drive 0:1 is ok physical drive 0:2 is ok physical drive 0:3 is ok physical drive 0:4 is ok physical drive 0:5 is ok | fan_1=50% fan_2=50% fan_3=50% temp_1_ioBoard=42;65;65 temp_2_ambient=18;40;40 temp_3_cpu=30;95;95 temp_4_cpu=30;95;95 temp_5_powerSupply=29;60;60
–verbose (or -v) can be repeated several times or given a numerical argument. The maximum level is -vvv. Using this level you will see a complete dump of all detected hardware components with all details.
nagios$ check_hpasm -vvv ... [CPU_0] cpqSeCpuSlot: 0 cpqSeCpuUnitIndex: 0 cpqSeCpuName: Intel Xeon cpqSeCpuStatus: ok info: cpu 0 is ok [PS_1] cpqHeFltTolPowerSupplyBay: 1 cpqHeFltTolPowerSupplyChassis: 0 cpqHeFltTolPowerSupplyPresent: present cpqHeFltTolPowerSupplyCondition: ok cpqHeFltTolPowerSupplyRedundant: redundant info: powersupply 1 is ok ... [FAN_1] cpqHeFltTolFanChassis: 1 cpqHeFltTolFanIndex: 1 cpqHeFltTolFanLocale: powerSupply cpqHeFltTolFanPresent: present cpqHeFltTolFanType: spinDetect cpqHeFltTolFanSpeed: normal cpqHeFltTolFanRedundant: redundant cpqHeFltTolFanRedundantPartner: 2 cpqHeFltTolFanCondition: ok cpqHeFltTolFanHotPlug: nonHotPluggable info: fan 1 is present, speed is normal, pctmax is 50%, location is powerSupply, redundance is redundant, partner is 2 ... [PHYSICAL_DRIVE] cpqDaPhyDrvCntlrIndex: 0 cpqDaPhyDrvIndex: 4 cpqDaPhyDrvBay: 5 cpqDaPhyDrvBusNumber: 1 cpqDaPhyDrvSize: 1864 cpqDaPhyDrvStatus: ok cpqDaPhyDrvCondition: ok ...
Blacklisting
If you want checks of failed/missing components to be skipped, so alerts caused by these are suppressed, then use the option –blacklist to blacklist them. With this option you give the plugin a list of items separated by / having the following format:
<typ>:<nr>[,<nr>...][/<typ>:<nr>[,<nr>...]]…
where <type> can take one of the following values:
| cpu | c |
| powersupply | p |
| fan | f |
| overall fan status | ofs |
| temperature | t |
| dimm | d |
| da controller | daco |
| da controller accelerator | daac |
| da controller accelerator battery | daacb |
| da logical drive | dald |
| da physical drive | dapd |
| scsi controller | scco |
| scsi logical drive | scld |
| scsi physical drive | scpd |
| fcal controller | fcaco |
| fcal accelerator | fcaac |
| fcal host controller | fcahc |
| fcal host controller overall condition | fcahco |
| fcal logical drive | fcald |
| fcal physical drive | fcapd |
| fuse | fu |
| enclosure manager | em |
The <nr> of a component can be found in the output of check_hpasm -v.
checking cpus cpu 0 is ok | c:0 cpu 1 is ok | c:1 checking power supplies powersupply 1 is ok | p:1 powersupply 2 is ok | p:2 checking fans fan 1 is present, speed is normal, .... | f:1 fan 2 is present, speed is normal, .... | f:2 fan 3 is present, speed is normal, .... | f:3 overall fan status: fan=ok, cpu=ok checking temperatures 1 ioBoard temperature is 42C (65 max) | t:1 2 ambient temperature is 18C (40 max) | t:2 3 cpu temperature is 30C (95 max) | t:3 4 cpu temperature is 30C (95 max) | t:4 5 powerSupply temperature is 29C (60 max) | t:5 checking memory dimm module 0:1 (module 1 @ cartridge 0) is ok | d:0:1 dimm module 0:2 (module 2 @ cartridge 0) is ok | d:0:2 dimm module 0:3 (module 3 @ cartridge 0) is ok | d:0:3 dimm module 0:4 (module 4 @ cartridge 0) is ok | d:0:4 dimm module 0:5 (module 5 @ cartridge 0) needs attention (degraded) | d:0:5 dimm module 0:6 (module 6 @ cartridge 0) is ok | d:0:6 dimm module 0:7 (module 7 @ cartridge 0) is ok | d:0:7 dimm module 0:8 (module 8 @ cartridge 0) is ok | d:0:8 checking disk subsystem da controller 3 in slot 0 is ok | daco:3 controller accelerator is ok | daac:3 controller accelerator battery is ok | daacb:3 logical drive 3:1 is ok (mirroring) | dald:3:1 logical drive 3:2 is ok (mirroring) | dald:3:2 physical drive 3:0 is ok | dapd:3:0 physical drive 3:1 is ok | dapd:3:1 physical drive 3:2 is ok | dapd:3:2 physical drive 3:3 is ok | dapd:3:3 ide controller 0 in slot -1 is ok and unused | ideco:0 fcal controller 1:0 in box 1/slot 0 needs attention (degraded) | fcaco:1:0 fcal accelerator in box 1/slot 0 is temp disabled | fcac:1:0 logical drive 1:1 is failed (advancedDataGuard) | fcald:1:1 physical drive 1:128 is failed | fcapd:1:128 physical drive 1:129 is ok | fcapd:1:129 physical drive 1:130 is failed | fcapd:1:130 physical drive 1:131 is ok | fcapd:1:131 physical drive 1:132 is failed | fcapd:1:132 physical drive 1:133 is ok | fcapd:1:133 physical drive 1:134 is ok | fcapd:1:134 physical drive 1:135 is ok | fcapd:1:135 physical drive 1:144 is ok | fcapd:1:144 physical drive 1:145 is ok | fcapd:1:145 physical drive 1:147 is unconfigured | fcapd:1:147 fcal host controller 0 in slot 1 is ok | fcahc:0 fcal host controller 1 in slot 1 is ok | fcahc:1
Assumed that you want to blacklist the failed memory module and the three failed hard disks (including the logical drive they belong to), you would write
d:0:5/fcapd:1:128,1:130,1:132/fcald:1:1
As an alternative you can write this string into the first line of a file and give the filename as an argument to –blacklist.
Custom temperature thresholds
If the system-default temperature thresholds should be overridden, use the –customthresholds option.
nagios$ check_hpasm ... 1 cpu temperature is 45C (62 max) 2 cpu temperature is 56C (80 max) 3 ioBoard temperature is 38C (60 max) 4 cpu temperature is 59C (80 max) 5 powerSupply temperature is 31C (53 max) ... nagios$ check_hpasm --customthresholds 1:70/5:65 ... 1 cpu temperature is 45C (70 max) 2 cpu temperature is 56C (80 max) 3 ioBoard temperature is 38C (60 max) 4 cpu temperature is 59C (80 max) 5 powerSupply temperature is 31C (65 max) ...
Performance data
With the option –perfdata you can switch on the output of performance data, if not already set as the default during installation. Should the perfdata string become too long, then use –perfdata=short which outputs a short form of the temperature tags (the location part will not be shown)
nagios$ check_hpasm OK - hardware working fine| fan_1=8%;0;0 fan_2=8%;0;0 fan_3=15%;0;0 fan_4=15%;0;0 fan_5=8%;0;0 fan_6=8%;0;0 fan_7=20%;0;0 fan_8=20%;0;0 'temp_1_processor_zone'=38;62;62 'temp_2_cpu#1'=37;73;73 'temp_3_i/o_zone'=49;68;68 'temp_4_cpu#2'=40;73;73 'temp_5_power_supply_bay'=36;44;44 nagios$ check_hpasm --perfdata short OK - hardware working fine| fan_1=8%;0;0 fan_2=8%;0;0 fan_3=15%;0;0 fan_4=15%;0;0 fan_5=8%;0;0 fan_6=8%;0;0 fan_7=20%;0;0 fan_8=20%;0;0 'temp_1'=38;62;62 'temp_2'=37;73;73 'temp_3'=49;68;68 'temp_4'=40;73;73 'temp_5'=36;44;44
Unknown memory status
With some Bios releases hpasmcli doesn’t display the memory modules correctly. The command SHOW DIMM shows only a list of modules with status n/a which is counted as a Warning. Using the –ignore-dimms you can skip memory checking without using a blacklist to avoid this warning.
Non-redundant fans
If you see a warning because all of the fans are not redundant, then this might be because ther are only single fans instead of pairs of fans on purpose. With –ignore-fan-redundancy you can suppress this warning. (See README).
Unfortunately it is not possible to show fan speed (or percent of max. speed) in SNMP mode. Therefore it is shown substituded by 50%.
Installation
- After unpacking the Archive, call the ./configure command. Attention should be paid to the –with-noinst-level option which defines the exit code of the plugin if no hpasm rpm was installed. With the option –with-degrees you tell the plugin whether you want temperature values displayed in celsius or fahrenheit. With the option –enable-perfdata you tell check_hpasm to add performance data to it’s output by default. If you don’t want to see type, serial number and biosrelease in the output, you can switch this off by using –disable-hwinfo. With –enable-hpacucli you activate checking of raid controllers.
- Grab the hpasm package suitable for your Linux distribution and install it. See the list of links below where to find it.
- If you run check_hpasm (in local mode) as a non-root user you will need sudo-privileges which allow you to call /sbin/hpasmcli as root without providing a password.
Examples
More examples for different error conditions:
memory module failed:
nagios$ check_hpasm CRITICAL - dimm module 2 @ cartridge 2 needs attention (dimm is degraded) nagios$ check_hpasm -v checking hpasmd process System :proliant dl580 g3 Serial No. :GB8632FB7V ROM version :P38 04/28/2006 checking cpus cpu 0 is ok cpu 1 is ok cpu 2 is ok cpu 3 is ok checking power supplies powersupply 1 is ok powersupply 2 is ok checking fans checking temperatures 1 cpu#1 temparature is 36 (80 max) 2 cpu#2 temparature is 34 (80 max) 3 cpu#3 temparature is 33 (80 max) 4 cpu#4 temparature is 37 (80 max) 5 i/o_zone temparature is 32 (60 max) 6 ambient temparature is 23 (40 max) 7 system_bd temparature is 34 (60 max) checking memory modules dimm 1@1 is ok dimm 2@1 is ok dimm 3@1 is ok dimm 4@1 is ok dimm 1@2 is ok dimm 2@2 is dimm is degraded dimm 3@2 is ok dimm 4@2 is ok CRITICAL - dimm module 2 @ cartridge 2 needs attention (dimm is degraded)
power supply module failed:
nagios$ ./check_hpasm CRITICAL - powersuply #2 needs attention (failed), powersuply #1 is not redundant nagios$ ./check_hpasm -v checking hpasmd process System :proliant dl580 g4 Serial No. :GB8637M8TH ROM version :P59 09/08/2006 checking cpus cpu 0 is ok cpu 1 is ok cpu 2 is ok cpu 3 is ok checking power supplies powersupply 1 is ok powersupply 2 is failed checking fans checking temperatures 1 cpu#1 temparature is 42 (85 max) 2 cpu#2 temparature is 46 (85 max) 3 cpu#3 temparature is 44 (85 max) 4 cpu#4 temparature is 44 (85 max) 5 i/o_zone temparature is 39 (60 max) 6 ambient temparature is 27 (40 max) 7 system_bd temparature is 41 (60 max) checking memory modules dimm 1@1 is ok dimm 2@1 is ok dimm 3@1 is ok dimm 4@1 is ok dimm 1@2 is ok dimm 2@2 is ok dimm 3@2 is ok dimm 4@2 is ok dimm 1@3 is ok dimm 2@3 is ok dimm 3@3 is ok dimm 4@3 is ok dimm 1@4 is ok dimm 2@4 is ok CRITICAL - powersuply #2 needs attention (failed), powersuply #1 is not redundant
power supply module pulled:
nagios$ ./check_hpasm CRITICAL - powersuply #2 is missing, powersuply #1 is not redundant nagios$ ./check_hpasm -v checking hpasmd process System :proliant dl580 g4 Serial No. :GB8637M8TH ROM version :P59 09/08/2006 checking cpus cpu 0 is ok cpu 1 is ok cpu 2 is ok cpu 3 is ok checking power supplies powersupply 1 is ok powersupply 2 is n/a checking fans checking temperatures 1 cpu#1 temparature is 42 (85 max) 2 cpu#2 temparature is 46 (85 max) 3 cpu#3 temparature is 44 (85 max) 4 cpu#4 temparature is 44 (85 max) 5 i/o_zone temparature is 39 (60 max) 6 ambient temparature is 27 (40 max) 7 system_bd temparature is 41 (60 max) checking memory modules dimm 1@1 is ok dimm 2@1 is ok dimm 3@1 is ok dimm 4@1 is ok dimm 1@2 is ok dimm 2@2 is ok dimm 3@2 is ok dimm 4@2 is ok dimm 1@3 is ok dimm 2@3 is ok dimm 3@3 is ok dimm 4@3 is ok dimm 1@4 is ok dimm 2@4 is ok CRITICAL - powersuply #2 is missing, powersuply #1 is not redundant
Hpasm daemon is not running:
nagios$ check_hpasm CRITICAL - hpasmd needs to be started
Hpasm software is not installed:
OK - hardware working fine, at least i hope so because hpasm is not installed
Call to participate
Please run check_hpasm -v on as many as possible different platforms. Chances are you have a rare Proliant model whose components are not detected completely. You will then see instructions on how to report this to the author.
The following line appears frequently but can be considered harmless:
#0 SYSTEM_BD - -
I am always interested in test data. If you want to do me a favour, send me the output of
snmpwalk ... <ip-adress> 1.3.6.1.4.1.232
or if you are using the local variant, i’d like to see the output of the following script:
hpasmcli=$(which hpasmcli)
hpacucli=$(which hpacucli)
for i in server powersupply fans temp dimm
do
$hpasmcli -s "show $i" | while read line
do
printf '%s %s\n' $i "$line"
done
done
if [ -x "$hpacucli" ]; then
for i in config status
do
$hpacucli ctrl all show $i | while read line
do
printf '%s %s\' $i "$line"
done
done
fiDownload
Externe Links
- hpasm RPM-Pakete
- hpacucli RPM-Pakete
- Win2003 System Management Driver
- Win2003 Insight Management Agents
- Managing Proliant Servers with Linux
- HPASM for Debian
- Nagios Homepage
- Nagios Plugins Exchange
- German Nagios Portal
- German Nagios Wiki
- EBuild for Gentoo
Changelog
- 2010-03-30 4.2 Bladesystems: Enclosure managers, Fuses und Temperaturen are now queried (looks like the latter are were not implemented by HP. At least i never saw temps in a snmpwalk), Proliant: blacklisting for SCSI-controller and -disks (Thanks Marco Hill) and for Overall Fan Status (Thanks Thomas Jampen)
- 2010-02-09 4.1.2 Bugfix in local mode if there are more than 1 logical drive (Thanks Trond Hasle).
- 2009-01-07 4.1.1 More smart array types are detected in local mode (Thanks Trond Hasle).
- 2009-12-07 4.1 Bugfix in powersupply-check with hpasmcli, Bladecenters show more details now.
- 2009-12-04 4.0.1 Added –help, fixed a bug in celsius-fahrenheit-conversion, enhanced fan logic, added support for models with a hidden product string (cpqsinfo-mib-error)
- 2009-11-30 4.0 Complete redesign of the code. Suppoer for G6-models, new blacklist-rules, verbose-mode with detailed output of the hardwrae components. Support for HP BladeCenter (cpqRack-MIB) and HP Storage-Systems (cpqStorage MIB).
- 2009-03-20 3.5 Support for SNMPv3, Bugfix for degraded dimms which were reported as missing, new parameter –port, support for MSA20, notice when /etc/sudoers is configured incorrectly. (Thanks Jeff the Riffer, matt at adicio.com)
- 2009-02-06 3.1.1 Bugfix which removes Perl-Warnings (Thanks Bill Katz and Martin Hofmann)
- 2009-01-23 3.1 support for ide and sas disks
- 2008-12-05 3.0.7.1 Minor Bugfix. snmpwalk now uses -On
- 2008-11-29 3.0.7 Bugfix in controller-blacklist. Using –snmpwalk
you don’t need Net::SNMP. - 2008-10-30 3.0.6 Bugfix in –ignore-dimms
- 2008-10-24 3.0.5 Shorter runtime thanks to fewer SNMP-Data (Thanks Yannick Gravel). New Option –ignore-fan-redundancy.
- 2008-09-18 3.0.4 Rewrite of the SNMP Dimm code
- 2008-09-11 3.0.3.2 -P is now optional (Bugfix)
- 2008-09-10 3.0.3.1 -P bugfixes
- 2008-09-10 3.0.3 Bugfix in snmpwalk cpqHeComponents. New Parameter –protocol (default: 2c)
- 2008-07-31 3.0.1 Bugfix in customthreshold (Thanks TheCry)
- 2008-07-28 3.0 SNMP (Thanks Matthias Flacke)
- 2008-04-16 2.0.3.1 configure-Bug fixed. (–with-perl, –with-perfdata)
- 2008-04-09 2.0.3 Blacklisting for Controllers. Dimm-Bug fixed.
- 2008-02-11 2.0.2 empty cpu&fan sockets are now properly handled
- 2008-02-08 2.0.1 multiline output for nagios 3.x
- 2008-02-08 2.0 complete code redesign, integrated raid checking with hpacucli
- 2008-01-18 1.6.2.2 Fixed misleading message under Debian 3.1
- 2007-12-12 1.6.2.1 Bugfix. Fans were overseen.
- 2007-11-16 1.6.2 New option -i, output of model, biosrelease and serial number by default (Thanks Marcus Fleige).
- 2007-11-07 1.6.1 Bugfix. Failed fans were possibly overseen. Perfdata use single quotes.
- 2007-07-27 1.6 Performance data.
- 2007-06-14 1.5 New option supports user-defined temperature thresholds.
- 2007-05-22 1.4 Support for hpasmxld and hpasmlited.
- 2007-04-18 1.3 Added –with-degrees to configure. Added –blacklist
- 2007-04-16 1.2 Added –with-noinst-level option to configure.
- 2007-04-14 1.1 First published release.
Copyright
Gerhard Lausser
Check_hpasm is released under the GNU General Public License. GPL
Author
Gerhard Lausser (gerhard.lausser@consol.de) will gladly answer your questions.
107 Responses to “check_hpasm”
-
Piotr Palka Says:
October 30th, 2009 at 0:05Hi! Found bug in a script, first power supply is not recognized, script depends on empty line between them. hpasmcli> show powersupply Power supply #1 Present : Yes Redundant: No Condition: FAILED Hotplug : Supported Power supply #2 Present : Yes Redundant: No Condition: Ok Hotplug : Supported
[Reply]
-
Monitor hardware-health on HP Proliant ML370 G3 with Nagios « Mozekoze Says:
November 7th, 2009 at 22:50[...] For nagios you’ll need the check_hpasm plugin, found here. [...]
-
Claudio Says:
November 10th, 2009 at 11:22Using this plugin for years now and still like it! Great work! Thanks for continuing the plugin!
[Reply]
-
Ovidiu Says:
November 26th, 2009 at 8:02How do you use this script with windows servers?
[Reply]
lausser Reply:
November 27th, 2009 at 20:05You need the hp system management driver and agent packages (look at the links above). Then you can query the server with SNMP. (check_hpasm –hostname –community …)
[Reply]
-
normes Says:
November 30th, 2009 at 10:34I’m sorry, but the Windows HP software (your link above) couldn’t installed on Proliant DL360 G6. Now I’m unsure which components I have to install from HP: HP Version Control Repository Manager HP System Management Homepage for Windows HP Version Control Agent for Windows HP ProLiant Array Configuration Utility (CLI) for Windows HP ProLiant Array Configuration Utility for Windows HP Insight Management WBEM Providers for Windows Server 2003/2008 HP ProLiant Integrated Management Log Viewer for Windows HP ProLiant Remote Monitor Service for Windows Server 2003/2008 HP Insight Diagnostics Online Edition for Windows Server 2003/2008 HP Insight Management Agents for Windows Server 2003/2008 HP NULL IPMI Controller Driver for Windows Server 2003 HP Insight Management WBEM Providers for Windows Server 2003/2008 Virtual Server Environment 4.1 Update1 HP ProLiant Array Diagnostics Utility for Windows HP ProLiant Firmware Inventory Agent for System Center Configuration Manager 2007
There are so many different packages… But no “Win2003 System Management Driver”. I’m using already the Windows integrated SNMP Server, so I hope I can use that with the HP tools.
Thanks,
Norman[Reply]
lausser Reply:
November 30th, 2009 at 11:47HP ProLiant DL360 G6 Server series – Download drivers and software
[Reply]
-
Geir O. Høgberg Says:
December 3rd, 2009 at 17:28Possible error regarding performance output. I see that it reports that -p is not a valid option anymore, fixed that with –enable-perfdata. Also, I get no output when I run ./check_hpasm -h or –help :) Besides from that, working as a charm and reporting good it seems. We are looking into some of the new things it picked up to see if they’re correct.
Thanks, Geir
[Reply]
-
tex Says:
December 4th, 2009 at 2:02This is in the blog part of the site, but I wanted to note it here: there is a bug when compiling to use Fahrenheit, so until fixed one may want to stick with Celsius.
[Reply]
-
Xavier Capell Says:
December 7th, 2009 at 19:13I am trying to blacklist an msa1000 controller but with no luck trying with the “-b” parameter. When I execute the following command I get the following output:
check_hpasm -v -H hostname -c public
…. … msa1000 controller in box 1 slot 1 needs attention msa1000 controller in box 1 slot 2 needs attention ….
I would like to blacklist these two entries. Is it possible? which argument should I send with the -b option?
thanks
[Reply]
lausser Reply:
December 7th, 2009 at 21:59Looks like you are using the old 3.x version of check_hpasm. You can’t blacklist a msa with it. Please upgrade to 4.1 and post the output again.
[Reply]
-
Peter R. Says:
December 8th, 2009 at 12:40Hallo, das ist ein wirklich tolles Tool, aber leider funktioniert es nicht ganz auf einem ‘proliant dl385 g2′ mit ‘hp-health-8.3.0′
check_hpasm (4.1) sagt: fan ist NICHT redundant:
fan 1 is present, speed is normal, pctmax is 50%, location is i/o_zone, redundance is notRedundant, partner is 0 …
hpasmcli sagt: fan IST redundant: Fan Location Present Speed of max Redundant Partner Hot-pluggable — ——– ——- —– —— ——— ——- ————-
1 I/O_ZONE Yes NORMAL 50% Yes 0 Yes
… Dabei glaube ich eher dem hpasmcli…
Schöne Grüße Peter
[Reply]
lausser Reply:
December 8th, 2009 at 14:55Ein Stück weiter oben steht unter “Aufruf zum Mitmachen” ein Script. Bitte schick mir dessen Output per Mail zu.
[Reply]
lausser Reply:
December 8th, 2009 at 19:33Jetzt verstehe ich, was da passiert ist.
fans Fan Location Present Speed of max Redundant Partner Hot-pluggable fans --- -------- ------- ----- ------ --------- ------- ------------- fans #1 I/O_ZONE Yes NORMAL 50% Yes 0 Yes fans #2 I/O_ZONE Yes NORMAL 50% Yes 0 Yes
Normalerweise sollte bei einem redundanten Fan unter der Spalte “Partner” die Nummer des anderen Fans stehen, mit dem zusammen er ein redundantes Pärchen bildet. Die Null weist darauf hin, dass etwas nicht stimmt. Das muss aber kein physikalisches Problem sein, es gibt auch zahlreiche Firmwarestände, auf die nicht 100% Verlass ist. Daher habe ich es so programmiert, dass in dem Fall der Lüfter von “redundant” auf “notRedundant” zurückgestuft wird. Dies führt aber nicht zu einem Fehler, da ein Partner=0 auch angezeigt wird, wenn z.B. bei 1-CPU-Maschinen anstelle des zweiten Lüfters nur ein Dummy eingebaut wird. In diesem Fall ist das nicht so, da man ja die Drehzahlen sieht. Zugegeben, die Ausgabe von check_hpasm entspricht nicht der von hpasmcli, aber auch dessen Angaben sind irreführend.Ich hoffe, damit können sie leben.
[Reply]
-
paul snoep Says:
December 9th, 2009 at 13:22Hi,
Great plugin, however for some mysterious reason our disk array is with the check_hpasm not recognized. We do can get output when run from commandline. My perl knowledge is too limited to debug and/or find the cause. Can you help?
Thanks
pacucli ctrl all show status
Smart Array P400i in Slot 0 (Embedded) Controller Status: OK Cache Status: OK Battery/Capacitor Status: OK
hpacucli ctrl all show config
Smart Array P400i in Slot 0 (Embedded) (sn: PH8CMQ4778 )
array A (SAS, Unused Space: 0 MB)
logicaldrive 1 (341.7 GB, RAID 5, OK)physicaldrive 1I:1:1 (port 1I:box 1:bay 1, SAS, 72 GB, OK) physicaldrive 1I:1:2 (port 1I:box 1:bay 2, SAS, 72 GB, OK) physicaldrive 1I:1:3 (port 1I:box 1:bay 3, SAS, 72 GB, OK) physicaldrive 1I:1:4 (port 1I:box 1:bay 4, SAS, 72 GB, OK) physicaldrive 2I:1:5 (port 2I:box 1:bay 5, SAS, 72 GB, OK) physicaldrive 2I:1:6 (port 2I:box 1:bay 6, SAS, 72 GB, OK)
[Reply]
lausser Reply:
December 9th, 2009 at 17:23Hi Paul, scroll up to the section “call to participate” and you will find a small shellscript. Can you run it and mail me the output please?
[Reply]
paul snoep Reply:
December 14th, 2009 at 14:23Hi,
Below the requested output of the script.
Thanks Paul
server server System : ProLiant DL360 G5 server Serial No. : CZJ902A7RF server ROM version : P58 05/18/2009 server iLo present : Yes server Embedded NICs : 2 server NIC1 MAC: 00:23:7d:a2:22:8e server NIC2 MAC: 00:23:7d:a2:22:96 server server Processor: 0 server Name : Intel Xeon server Stepping : 10 server Speed : 3000 MHz server Bus : 1333 MHz server Core : 4 server Thread : 4 server Socket : 1 server Level2 Cache : 12288 KBytes server Status : Ok server server Processor: 1 server Name : Intel Xeon server Stepping : 10 server Speed : 3000 MHz server Bus : 1333 MHz server Core : 4 server Thread : 4 server Socket : 2 server Level2 Cache : 12288 KBytes server Status : Ok server server Processor total : 2 server server Memory installed : 8192 MBytes server ECC supported : Yes server powersupply powersupply Power supply #1 powersupply Present : Yes powersupply Redundant: Yes powersupply Condition: Ok powersupply Hotplug : Supported powersupply Power supply #2 powersupply Present : Yes powersupply Redundant: Yes powersupply Condition: Ok powersupply Hotplug : Supported powersupply fans fans Fan Location Present Speed of max Redundant Partner Hot-pluggable fans — ——– ——- —– —— ——— ——- ————- fans #1 POWERSUPPLY_BAY Yes NORMAL 34% Yes 0 No fans #2 CPU#2 Yes NORMAL 29% Yes 0 No fans #3 CPU#1 Yes NORMAL 37% Yes 0 No fans fans temp temp Sensor Location Temp Threshold temp —— ——– —- ——— temp #1 I/O_ZONE 44C/111F 65C/149F temp #2 AMBIENT 20C/68F 40C/104F temp #3 CPU#1 30C/86F 95C/203F temp #4 CPU#1 30C/86F 95C/203F temp #5 POWER_SUPPLY_BAY 33C/91F 60C/140F temp #6 CPU#2 30C/86F 95C/203F temp #7 CPU#2 30C/86F 95C/203F temp temp dimm dimm DIMM Configuration dimm —————— dimm Cartridge #: 0 dimm Module #: 1 dimm Present: Yes dimm Form Factor: fh dimm Memory Type: 14h dimm Size: 1024 MB dimm Speed: 667 MHz dimm Supports Lock Step: No dimm Configured for Lock Step: No dimm Status: Ok dimm dimm Cartridge #: 0 dimm Module #: 2 dimm Present: Yes dimm Form Factor: fh dimm Memory Type: 14h dimm Size: 1024 MB dimm Speed: 667 MHz dimm Supports Lock Step: No dimm Configured for Lock Step: No dimm Status: Ok dimm dimm Cartridge #: 0 dimm Module #: 3 dimm Present: Yes dimm Form Factor: fh dimm Memory Type: 14h dimm Size: 1024 MB dimm Speed: 667 MHz dimm Supports Lock Step: No dimm Configured for Lock Step: No dimm Status: Ok dimm dimm Cartridge #: 0 dimm Module #: 4 dimm Present: Yes dimm Form Factor: fh dimm Memory Type: 14h dimm Size: 1024 MB dimm Speed: 667 MHz dimm Supports Lock Step: No dimm Configured for Lock Step: No dimm Status: Ok dimm dimm Cartridge #: 0 dimm Module #: 5 dimm Present: Yes dimm Form Factor: fh dimm Memory Type: 14h dimm Size: 1024 MB dimm Speed: 667 MHz dimm Supports Lock Step: No dimm Configured for Lock Step: No dimm Status: Ok dimm dimm Cartridge #: 0 dimm Module #: 6 dimm Present: Yes dimm Form Factor: fh dimm Memory Type: 14h dimm Size: 1024 MB dimm Speed: 667 MHz dimm Supports Lock Step: No dimm Configured for Lock Step: No dimm Status: Ok dimm dimm Cartridge #: 0 dimm Module #: 7 dimm Present: Yes dimm Form Factor: fh dimm Memory Type: 14h dimm Size: 1024 MB dimm Speed: 667 MHz dimm Supports Lock Step: No dimm Configured for Lock Step: No dimm Status: Ok dimm dimm Cartridge #: 0 dimm Module #: 8 dimm Present: Yes dimm Form Factor: fh dimm Memory Type: 14h dimm Size: 1024 MB dimm Speed: 667 MHz dimm Supports Lock Step: No dimm Configured for Lock Step: No dimm Status: Ok dimm dimm config config Smart Array P400i in Slot 0 (Embedded) (sn: PH8CMQ4778 ) config config array A (SAS, Unused Space: 0 MB) config config logicaldrive 1 (341.7 GB, RAID 5, OK) config config physicaldrive 1I:1:1 (port 1I:box 1:bay 1, SAS, 72 GB, OK) config physicaldrive 1I:1:2 (port 1I:box 1:bay 2, SAS, 72 GB, OK) config physicaldrive 1I:1:3 (port 1I:box 1:bay 3, SAS, 72 GB, OK) config physicaldrive 1I:1:4 (port 1I:box 1:bay 4, SAS, 72 GB, OK) config physicaldrive 2I:1:5 (port 2I:box 1:bay 5, SAS, 72 GB, OK) config physicaldrive 2I:1:6 (port 2I:box 1:bay 6, SAS, 72 GB, OK) config status status Smart Array P400i in Slot 0 (Embedded) status Controller Status: OK status Cache Status: OK status Battery/Capacitor Status: OK status status
[Reply]
lausser Reply:
December 14th, 2009 at 15:42Where is your hpacucli located? check_hpasm tries to find it in /usr/sbin/hpacucli and /usr/local/sbin/hpacucli. If it is unable to locate the command, the array check will be skipped. Maybe this is the cause.
[Reply]
-
Waruna Says:
December 18th, 2009 at 10:55hi All My error CRITICAL – sudo must be configured with requiretty=no (man sudo), System: ‘unknown’, S/N: ‘unknown’, ROM: ‘unknown’
my configuration like this
/etc/nagios/localhost.cfg
define service{ use local-service host_name adlive service_description Check HP Hardware check_command check_hpasm }
/etc/nagios/commands.cfg define command{ command_name check_hpasm command_line $USER1$/check_hpasm }
And
Add this lines to /etc/sudoers
Cmnd_Alias HPASM = /usr/sbin/hpacucli, /sbin/hpacucli, /usr/lib/nagios/plugins/check_hpasm
nagios ALL = HPASM
nagios ALL=(ALL) NOPASSWD: ALL
I get Error in nagios web interface
CRITICAL – sudo must be configured with requiretty=no (man sudo), System: ‘unknown’, S/N: ‘unknown’, ROM: ‘unknown’
Pl help to correct it
[Reply]
Waruna Reply:
December 18th, 2009 at 11:06@Waruna, I can run check_hpasm without password like this
[root@abcd plugins]# su nagios sh-3.2$ sudo ./check_hpasm OK – System: ‘proliant dl380 g5′, S/N: ‘SGA810XNVC’, ROM: ‘P56 08/03/2008′, hardware working fine sh-3.2$
but I get Error in nagios web interface
CRITICAL – sudo must be configured with requiretty=no (man sudo), System: ‘unknown’, S/N: ‘unknown’, ROM: ‘unknown’
Pl help thnx
[Reply]
lausser Reply:
December 18th, 2009 at 12:19You need sudo-privileges for the hpasmcli command, not for the check_hpasm plugin.
[Reply]
lausser Reply:
December 18th, 2009 at 12:18Everything you need to to is mentioned in the error message. Read the sudo-manpage, look for requiretty and set this parameter in your /etc/sudoers to ‘no’. A running Nagios process has no controlling tty, that’s why you need this setting.
[Reply]
-
netrogue Says:
January 18th, 2010 at 15:11hi, we can monitor hp-ux with check_hpasm ?
[Reply]
lausser Reply:
January 22nd, 2010 at 2:32I never tried it. You surely cannot monitor hp-ux, but, if at all, the hardware of a server running hp-ux. Precondition is the presence of the CPQHLT-MIB. Try “snmpwalk … 1.3.6.1.4.1.232″. If you get a response, you might give check_hpasm a try.
[Reply]
-
Stefan Says:
February 1st, 2010 at 15:08Hallo,
erst einmal danke für die super Arbeit! Ich habe einen kleinen Bug entdeckt. Die internen HP Tools melden mir eine defekte Platte. Der hpasm_check meldet mir aber das alles OK ist.
Zu sehen hier: http://pastie.org/804084
Also nicht ganz unkritisch das Ganze.
Grüße, Stefan
[Reply]
lausser Reply:
February 1st, 2010 at 15:35Was sagt “check_hpasm … -vvv” dazu? Könnte ich bitte den Output von “snmpwalk … 1.3.6.1.4.1.232″ per Mail bekommen?
[Reply]
Stefan Reply:
February 1st, 2010 at 15:54Mail ist raus.
[Reply]
lausser Reply:
February 2nd, 2010 at 18:59Tja, dumme Sache. Die Daten im snmpwalk zeigen 6 tiptop funktionierende Platten an. Wer hat jetzt recht? Leuchtet irgendeine rote LED an der Platte? Kannst du mal /etc/init.d/hpasm durchstarten und “hpacucli rescan” ausführen? Sind beide Methoden dann immer noch unterschiedlicher Meinung?
[Reply]
Stefan Reply:
February 3rd, 2010 at 15:49Die Platte wurde über die LED als defekt angezeigt. Die Platte wurde von mir noch am 01.02 ausgetauscht da es kein ganz unkritisches System ist, daher kann ich darüber leider nichts mehr sagen.
Wenn ich wieder so einen Fall entdecke werde ich mich wieder melden.
Danke für die Hilfe.
[Reply]
-
Peter Says:
February 2nd, 2010 at 0:39It certainly looks like you have a fine add-on Nagios monitor for HP servers from the reviews. One issue that makes this add-on completely confusing for those of us that don’t have 200 HP servers is what parts of the HP System Management Software are we to download from HP and install on Windows servers. I see several people ask this question and all you guys do is provide a link to a drivers download page for a particular HP model. Now obviously the authors of this module know exactly what is required to be installed. Why not just give it up and give us a list? Most of us admins don’t have time to eat or take a crap, let alone go on a wild goose chase to make this thing work.
[Reply]
-
lausser Says:
February 2nd, 2010 at 15:57No, the author does not know exactly what is required to be installed. The author has also just a single HP under his desk which he bought from ebay. And it’s not even running Windows. So the only information i can offer is: “System Management Driver” + “Insight Management Agents”. To find the right software for a particular model was no problem for hundreds of users. Sorry, i spent months of my free time writing and maintaining this software for the sole purpose to give it away for free and help people. At least i had some fun writing the code. Anyone can take it and be happy with it.
What this is not: a free all-inclusive no-worries allround-package. Sorry, if an admin has not the time to eat and sleep, this is not my problem. You ask no less from me than to spent my spare time or spend my worktime (which means betray my employer) for free. This is not how Open Source works. Sorry for this rude reply.[Reply]
-
Claudio Says:
February 5th, 2010 at 9:45@Peter: A real admin reads all documentations about a server he bought or is about to buy and therefore would understand the possibilities of monitoring with System Management software.
lausser made a great check plugin for Nagios but it certainly won’t get you your coffee right at your desk or give you additional brain cells.
I know it’s not always easy to be an admin, nobody says thanks when everything runs smoothly, but it’s our friggin job to THINK and read and learn and think even more.
[Reply]
-
tex Says:
February 12th, 2010 at 4:18We have some Proliant DL380 G6 units with the 8.30 HP tool set. We have found that the hpasmcli is broken in the following manner: hpasmcli -s “show dimms” fails with: *** glibc detected *** free(): invalid pointer: 0x08068ce4 ***
but if one runs hpasmcli manually and then type the “show dimms” command, it works!
I cannot find anyone seeing this same problem, our IT group may open a ticket with HP about this since we have the latest version of the tools as far as I can tell. The IT group regressed back all the way to 7.9 to fix this problem, but now I see that it is segfaulting most of the time, not reporting all the memory and not reporting the temperatures. So I am going to have them go back to 8.30 and blacklist the dimms for now.
Obviously this isn’t a problem with check_hpasm, but have you ever seen a problem like this?
thanks
[Reply]
-
Benzke Says:
February 24th, 2010 at 17:56Hi tex, i have exactly the same issues. I also have an open ticket with hp since the 1st October 09 concerning this issue… Our G6 servers are already in production use so this is extremely annoying. This has to be the worst hardware support i have ever experienced from any company… It was over two months writing forth and back until the folks at hp finally admitted it was a problem on their side and not with my OS (rhel4). According to hp rhel4 is verified for the G6 so it really makes me wonder if those guys did run any testing on that platform at all before releasing them to the public. Cheers, Benzke
[Reply]
-
Chris Says:
February 24th, 2010 at 22:24kann ich über dieses Plugin ein Windows 2008 64 bit System überwachen ???
Grüße
Chris
[Reply]
lausser Reply:
February 25th, 2010 at 3:00Ja, sollte kein Problem sein. Natürlich muss auf der Maschine die entsprechende HP-Management-Software installiert werden, damit der Hardwarezustand per SNMP abgefragt werden kann.
[Reply]
-
Andy Says:
February 25th, 2010 at 16:14Hallo, habe da ein Problem mit einem DL360 G5: ./check_hpasm -H “ProLiant DL360 G5″ -v meldet mir:
Use of uninitialized value $romversion in pattern match (m//) at ./check_hpasm line 846. Use of uninitialized value $romversion in pattern match (m//) at ./check_hpasm line 846. Use of uninitialized value $Proliant::Hardware::Hpasm::Server::serial in sprintf at ./check_hpasm line 818. Use of uninitialized value $Proliant::Hardware::Hpasm::Server::rom in sprintf at ./check_hpasm line 819. Use of uninitialized value $Proliant::Hardware::Hpasm::Server::serial in sprintf at ./check_hpasm line 205. Use of uninitialized value $Proliant::Hardware::Hpasm::Server::rom in sprintf at ./check_hpasm line 205. OK – System: ”, S/N: ”, ROM: ”, hardware working fine| System : Serial No. : ROM version : kann man das was machen? Danke, Gruß Andy
[Reply]
lausser Reply:
February 25th, 2010 at 17:58Dazu müsste ich den Output von
snmpwalk ….. 1.3.6.1.4.1.232
sehen. Könnte ich den per Mail bekommen?
[Reply]
-
Waruna Says:
March 1st, 2010 at 10:04I try to user this check_hpasm with DL370 g6 & OS RHEL 4 U 7, I did the latest firmware upgrade 1/13/2010 in HP site, but error came like please upgrade firmware [root@a_aa1 plugins]# ./check_hpasm *** glibc detected *** free(): invalid pointer: 0x00c02820 *** WARNING – status of all 0 dimms is n/a (please upgrade firmware), System: ‘proliant dl370 g6′, S/N: ‘XXXXX’, ROM: ‘P63 01/13/2010′
but it is ok with DL370 g6 & OS RHEL 5 U 2,
[root@a_app1 plugins]# ./check_hpasm OK – System: ‘proliant dl370 g6′, S/N: ‘XXXXXXX’, ROM: ‘P63 01/13/2010′, hardware working fine
please help me to user this plugin for RHEL 4U7
[Reply]
lausser Reply:
March 1st, 2010 at 12:17“*** glibc detected *** free(): invalid pointer…..” is not a check_hpasm-message. It surly comes from the hpasmcli command (which is executed by check_hpasm).
hpasmcli -s “show dimm”
should bring you this error message. Only HP can tell you what’s wrong.
[Reply]
-
Peter Andersson Says:
March 5th, 2010 at 10:49Hi
Thanks Gerhard for a great nagios plugin!
I have written a blog entry howto install the HP software, configure SNMP and configure Nagios to get it running. Take a peak at: http://www.it-slav.net/blogs/2010/03/02/monitor-hp-proliant-with-nagios-or-op5-monitor/
[Reply]
-
Rico Says:
March 23rd, 2010 at 20:49Hi, I get the following error on one of my Boxes: CRITICAL – fcal host controller 2 in slot 5 reports problems (ok), fcal host controller 3 in slot 5 reports problems (ok), System: proliant dl580 g4, S/N: xxxxxxxxxx, ROM: P59 08/10/2007
But i cannot see any problems when i log in to the managementpage of the Box. How to deal with this?
bye!
[Reply]
lausser Reply:
March 24th, 2010 at 15:43Please mail me the output of
snmpwalk ….. 1.3.6.1.4.1.232
[Reply]
-
Marco Hill Says:
March 24th, 2010 at 17:37Hallo,
erstmal ein grosses dankeschön für ein weltklasse Nagiosplugin. :) Ich habe da mal eine kurze Frage. Ich würde gerne einen scsi controller und eine physikal drive blacklisten. welches typ-kuerzel muss ich da nehmen? In der liste oben finde ich es nicht. Die -v ausgabe zu dem controller ist:
scsi controller in slot 4 is ok scsi controller in slot 5 needs attention physical drive 4:0 is failed
Danke
Gruss Marco
[Reply]
lausser Reply:
March 24th, 2010 at 19:08Ich sehe gerade, dass das Blacklisten für SCSI-Equipment gar nicht implementiert ist. Könnte ich bitte per Mail Testdaten kriegen (weiter oben unter Aufruf zum Mitmachen beschrieben), ich hol’s dann schnell nach.
[Reply]
Marco Hill Reply:
March 25th, 2010 at 16:11Ich habe da noch eine Kleinigkeit. Sollte der snmpwalk befehl nicht wie folgt aussehen?
snmpwalk 1.3.6.1.4.1.232
Oben sind IP und 1.3.6.1.4.1.232 vertauscht.
Gruss Marco
[Reply]
-
Mirko Says:
March 26th, 2010 at 15:57Hello thanks for this awesome plugin!!! Is there any easy way to disable perf-data output for FANs?
Since we use it in SNMP mode only, the never ending value of 50% value is unuseful, and could be suppressed.
Thanks again Cheers Mirko
[Reply]
lausser Reply:
March 26th, 2010 at 19:02Find the following portion of code
and comment out the five lines inside the if-clause.if ($self->{runtime}->{options}->{perfdata}) { $self->{runtime}->{plugin}->add_perfdata( label => sprintf('fan_%s', $self->{cpqHeFltTolFanIndex}), value => $self->{cpqHeFltTolFanPctMax}, uom => '%', ); }
[Reply]
-
badoshi Says:
March 29th, 2010 at 17:37Hi,
This plugin is fantastic and works great with our vmware & red hat servers.
Is it possible to use this with Solaris 10 x86 too? I have tried compiling and running, but get the following error:
bash-3.00# /usr/local/nagios/libexec/check_hpasm ps: unknown output format: -o cmd usage: ps [ -aAdeflcjLPyZ ] [ -o format ] [ -t termlist ] [ -u userlist ] [ -U userlist ] [ -G grouplist ] [ -p proclist ] [ -g pgrplist ] [ -s sidlist ] [ -z zonelist ] ‘format’ is one or more of: user ruser group rgroup uid ruid gid rgid pid ppid pgid sid taskid ctid pri opri pcpu pmem vsz rss osz nice class time etime stime zone zoneid f s c lwp nlwp psr tty addr wchan fname comm args projid project pset CRITICAL – hpasmd needs to be restarted, System: ‘unknown’, S/N: ‘unknown’, ROM: ‘unknown’
Could this be an issue between Solaris ‘ps’ command, and GNU ‘ps’?
Thanks,
[Reply]
lausser Reply:
March 30th, 2010 at 10:28Yes, the problem is the “-ocmd” argument for the ps command. Can you please search the code for -ocmd and modify the matching line so it looks like
if (open PS, "/bin/ps -e -oargs|") {[Reply]
-
Tom Says:
March 30th, 2010 at 8:05Hallo und herzlichen Dank für das tolle Plugin!
Wir haben es für mehrere ProLiant DL380 Servers im Einsatz. Mit den G4, G5 und G6 läufts super, nur mit unseren beiden G3 Servern habe ich ein Problem. Für beide Server liefert das Skript den folgenden Output:
nagios:~# /usr/lib/nagios/plugins/check_hpasm --blacklist f:1,3,8 --ignore-fan-redundancy --community foo --hostname bar
CRITICAL - system fan overall status is failed, cpu fan overall status is failed, System: 'proliant dl380 g3', S/N: 'foobar', ROM: 'P29 09/15/2004' | fan_1=0% fan_2=50% fan_3=0% fan_4=50% fan_5=50% fan_6=50% fan_7=50% fan_8=0% temp_1_cpu=39;62;62 temp_2_cpu=41;73;73 temp_3_ioBoard=51;68;68 temp_5_powerSupply=36;55;55
Ist bei beiden tatsächlich etwas kaputt oder hat das Skript einen Fehler? Ich verwende check_hpasm Version 4.1.2.
Herzlichen Dank und freundliche Grüsse Tom
[Reply]
lausser Reply:
March 30th, 2010 at 10:34Könnte ich bitte per Mail den Output von
bekommen? Wäre durchaus möglich, daß da etwas kaputt ist, da bei den Fans 1, 3 und 8 keine Drehzahl angezeigt wird. Du könntest es auch mal mit -vv aufrufen, damit siehst du mehr Details.snmpwalk -v 2c -c foo bar 1.3.6.1.4.1.232
[Reply]
-
Grzegorz Says:
April 8th, 2010 at 11:32I’m trying to install 4.2 version on my Red Hat EL 5.4 servers, but i got such error:
[root@monitor-prod check_hpasm-4.2]# ./configure –enable-perfdata –enable-hpacucli –enable-extendedinfo checking for a BSD-compatible install… /usr/bin/install -c checking whether build environment is sane… yes checking for a thread-safe mkdir -p… /bin/mkdir -p checking for gawk… gawk checking whether make sets $(MAKE)… yes checking how to create a pax tar archive… gnutar checking build system type… x86_64-unknown-linux-gnu checking host system type… x86_64-unknown-linux-gnu checking for a BSD-compatible install… /usr/bin/install -c checking whether make sets $(MAKE)… (cached) yes checking for gawk… (cached) gawk checking for sh… /bin/sh checking for perl… /usr/bin/perl configure: creating ./config.status config.status: creating Makefile config.status: creating plugins-scripts/Makefile config.status: creating plugins-scripts/subst –with-perl: /usr/bin/perl –with-nagios-user: nagios –with-nagios-group: nagios –with-noinst-level: unknown –with-degrees: unknown –enable-perfdata: yes –enable-extendedinfo: yes –enable-hwinfo: yes –enable-hpacucli: yes [root@monitor-prod check_hpasm-4.2]# make Making all in plugins-scripts make[1]: Entering directory
/root/check_hpasm-4.2/plugins-scripts' make[1]: *** No rule to make targetHP/BladeSystem/Component/CommonEnclosureSubsystem/ManagerSubsystem.pm’, needed bycheck_hpasm'. Stop. make[1]: Leaving directory/root/check_hpasm-4.2/plugins-scripts’ make: *** [all-recursive] Error 1I have already installed check_hpasm v. 3.5 and i didn’t have any problems with installation. I decided to upgrade because of error with “losing” power supply. Actually, error message says nothing for me. Do I need some more perl stuff installed?
[Reply]
lausser Reply:
April 8th, 2010 at 11:58Hi, i think your tar is not able to unpack files with a filename longer than ~100 characters. That’s why make doesn’t find the …..ManagerSubsystem.pm file. There is also a check_hpasm-4.2.shar.gz you can download. Please get it and unpack the contents with
cat check_hpasm-4.2.shar.gz | gzip -d | sh
[Reply]
-
Grzegorz Says:
April 8th, 2010 at 12:09OK, i just avoided problem by removing ManagerSubsystem.pm part from “EXTRA_MODULES =” in plugins-scripts Makefile.
[Reply]
-
Sebastien douce Says:
April 16th, 2010 at 12:13Hello,
first Thank you for your work !
I encounter this kind of Probleme on one Linux Server .
When il execute locally check_hpasm : ./check_hpasm OK – System: ‘proliant dl585 g2′, S/N: ‘GB8730NP6F’, ROM: ‘A07 02/27/2007′, hardware working fine, da: 1 logical drives, 5 physical drives, cpu_0=ok cpu_1=ok cpu_2=ok cpu_3=ok ps_1=ok ps_2=ok fan_1=34% …etc
And i try to execute from Nagios poller i receive : CRITICAL – dimm module 0:17 (module 17 @ cartridge 0) needs attention (n/a), dimm module 0:18 (module 18 @ cartridge 0) needs attention (n/a), dimm module 0:25 (module 25 @ cartridge 0) needs attention (n/a), dimm module 0:26 (module 26 @ cartridge 0) needs attention (n/a)CRITICAL – dimm module 0:17 (module 17 @ cartridge 0) needs attention (n/a), dimm module 0:18 (module 18 @ cartridge 0) needs attention (n/a), dimm module 0:25 (module 25 @ cartridge 0) needs attention (n/a), dimm module 0:26 (module 26 @ cartridge 0) needs attention (n/a)
The Server is fine working actually and HP agent answer well , do you have any idea ?
[Reply]
lausser Reply:
April 17th, 2010 at 12:11I never saw this behaviour. So you don’t use the SNMP method, but are executing check_hpasm locally on the server (where you have a hpasmcli command)? Are only Dimm modules shown as failed or also other components?
[Reply]
Sebastien douce Reply:
April 22nd, 2010 at 23:35@lausser, hpasmcli work as well , no dimm problems .. I try to restart snmp and hpasm, the server reboot as well … Locally check_hpasm work as well but if i try locally check_hpasm -H 127.0.0.1 , same problem !!
I dont where the snmp has been corrupted … i have many server identic just one cause it .. Thnaks ..
[Reply]
lausser Reply:
April 26th, 2010 at 17:33can you send me the output of the following command please?
snmpwalk .... 127.0.0.1 1.3.6.1.4.1.232
[Reply]
-
ckpinguin Says:
April 27th, 2010 at 9:43Your work is very much appreciated. I try to convince bosses to bring up some money ;-)
[Reply]
-
hec Says:
April 27th, 2010 at 15:22Hallo lausser, wir haben das Problem, dass das Plugin manchmal in einen Timeout läuft (WAN Strecke…). Gibt es eine Möglichkeit dem Plugin zu sagen das es bei einem TimeOut kein Critical State geben soll, sondern lediglich Warning?
Danke für die Info.
[Reply]
lausser Reply:
April 27th, 2010 at 16:27Hi, ich sehe gerade, daß das Plugin selbst gar kein Timeout-Handling macht. Es ist also Nagios, das die Zeitüberschreitung feststellt und den Errorlevel festlegt. Ich würde ggf. die standardmässigen 60s mit dem Parameter service_check_timeout hochdrehen.
[Reply]
-
hec Says:
April 27th, 2010 at 16:42Hi, ja das hab ich schon getan, teilweise auch auf 90, wobei ich, wenn ich mich durch die status.dat grepe execution_time bis 170 sekunden (!!) habe. der timeout also einfach ignoriert wird.
[Reply]
-
ckpinguin Says:
May 11th, 2010 at 11:31Ist es möglich bzw. sinnvoll, bei Angabe von –blacklist, die entsprechenden Komponenten auch nicht mehr als Performancedaten zu liefern? Wir haben hier DL380 im Einsatz, die immer mal wieder Fantasiewerte bei 3 Sensoren liefern, so schauen die pnp4nagios-Grafiken auch nicht gerade toll aus.
Vielen Dank für Eure Arbeit!
[Reply]
lausser Reply:
May 12th, 2010 at 19:44Könntest du bitte was ausprobieren? Such dir im Plugin die Routine “sub add_perfdata” und ändere die letzte Zeile folgendermassen:
push (@{$self->{perfdata}}, $str) unless $self->{blacklisted};
[Reply]
-
Jimmy liu Says:
May 23rd, 2010 at 9:24Hi What’s wrong with me?pls help me,thanks~~~ [root@localhost libexec]# /usr/local/nagios/libexec/check_hpasm -H 192.168.0.231 -C public CRITICAL – could not find Net::SNMP module, wrong device
[Reply]
lausser Reply:
May 24th, 2010 at 20:15@Jimmy liu, you need to install the perl module Net::SNMP
[Reply]
-
Nikolas Nunez Says:
June 8th, 2010 at 8:01I have recently installed the plugin on several HP DL360 servers, but on at least two servers, when running the check_hpasm -v, the power supplies don’t show up.
Any ideas
[Reply]
lausser Reply:
June 8th, 2010 at 11:39Please look at the “call to participate” section of the check_hpasm-website. You’ll find two ways to send me diagnostic info. Please run either the snmpwalk or the local script and forward me the output, so i can check what’s wrong.
[Reply]
Nikols Nunez Reply:
June 8th, 2010 at 22:21I run the script and the following is shown :
server server System : ProLiant DL360 G4p server Serial No. : GB8633HERR server ROM version : P54 02/14/2006 server iLo present : Yes server Embedded NICs : 2 server NIC1 MAC: 00:18:71:e3:ae:da server NIC2 MAC: 00:18:71:e3:ae:d9 server server Processor: 0 server Name : Intel Xeon server Stepping : 10 server Speed : 3000 MHz server Bus : 800 MHz server Socket : 2 server Level2 Cache : 2048 KBytes server Status : Ok server server Processor: 1 server Name : Intel Xeon server Stepping : 10 server Speed : 3000 MHz server Bus : 800 MHz server Socket : 1 server Level2 Cache : 2048 KBytes server Status : Ok server server Processor total : 2 server server Memory installed : 4096 MBytes server ECC supported : Yes server powersupply powersupply Command NOT supported on this server at this time powersupply powersupply fans fans Command NOT supported on this server at this time fans fans temp temp Sensor Location Temp Threshold temp —— ——– —- ——— temp #0 SYSTEM_BD – - temp #1 I/O_ZONE 40C/104F 63C/145F temp #2 CPU#1 43C/109F 85C/185F temp #3 CPU#2 41C/105F 85C/185F temp #4 POWER_SUPPLY_BAY 31C/87F 48C/118F temp #5 SYSTEM_BD 27C/80F 41C/105F temp temp dimm dimm DIMM Configuration dimm —————— dimm Cartridge #: 0 dimm Module #: 1 dimm Present: Yes dimm Form Factor: 9h dimm Memory Type: 12h dimm Size: 1024 MB dimm Speed: 400 MHz dimm Status: Ok dimm dimm Cartridge #: 0 dimm Module #: 2 dimm Present: Yes dimm Form Factor: 9h dimm Memory Type: 12h dimm Size: 1024 MB dimm Speed: 400 MHz dimm Status: Ok dimm dimm Cartridge #: 0 dimm Module #: 3 dimm Present: Yes dimm Form Factor: 9h dimm Memory Type: 12h dimm Size: 1024 MB dimm Speed: 400 MHz dimm Status: Ok dimm dimm Cartridge #: 0 dimm Module #: 4 dimm Present: Yes dimm Form Factor: 9h dimm Memory Type: 12h dimm Size: 1024 MB dimm Speed: 400 MHz dimm Status: Ok dimm dimm config \config Smart Array 6i in Slot 0 (Embedded)\config \config array A (Parallel SCSI, Unused Space: 0 MB)\config \config \config logicaldrive 1 (136.7 GB, RAID 1, OK)\config \config physicaldrive 1:0 (port 1:id 0 , Parallel SCSI, 146.8 GB, OK)\config physicaldrive 1:1 (port 1:id 1 , Parallel SCSI, 146.8 GB, OK)\config \status \status Smart Array 6i in Slot 0 (Embedded)\status Controller Status: OK\status Cache Status: OK\status \status \
It’s rather weird because I have other DL360 G4p that don’t have this problem.
[Reply]
Nikolas Nunez Reply:
June 9th, 2010 at 8:00Please find below the output of the script. Furthermore I have run this command on another server with the same specs and the output does register the power supplies
server server System : ProLiant DL360 G4p server Serial No. : GB8633HERR server ROM version : P54 02/14/2006 server iLo present : Yes server Embedded NICs : 2 server NIC1 MAC: 00:18:71:e3:ae:da server NIC2 MAC: 00:18:71:e3:ae:d9 server server Processor: 0 server Name : Intel Xeon server Stepping : 10 server Speed : 3000 MHz server Bus : 800 MHz server Socket : 2 server Level2 Cache : 2048 KBytes server Status : Ok server server Processor: 1 server Name : Intel Xeon server Stepping : 10 server Speed : 3000 MHz server Bus : 800 MHz server Socket : 1 server Level2 Cache : 2048 KBytes server Status : Ok server server Processor total : 2 server server Memory installed : 4096 MBytes server ECC supported : Yes server powersupply powersupply Command NOT supported on this server at this time powersupply powersupply fans fans Command NOT supported on this server at this time fans fans temp temp Sensor Location Temp Threshold temp —— ——– —- ——— temp #0 SYSTEM_BD – - temp #1 I/O_ZONE 40C/104F 63C/145F temp #2 CPU#1 42C/107F 85C/185F temp #3 CPU#2 42C/107F 85C/185F temp #4 POWER_SUPPLY_BAY 30C/86F 48C/118F temp #5 SYSTEM_BD 26C/78F 41C/105F temp temp dimm dimm DIMM Configuration dimm —————— dimm Cartridge #: 0 dimm Module #: 1 dimm Present: Yes dimm Form Factor: 9h dimm Memory Type: 12h dimm Size: 1024 MB dimm Speed: 400 MHz dimm Status: Ok dimm dimm Cartridge #: 0 dimm Module #: 2 dimm Present: Yes dimm Form Factor: 9h dimm Memory Type: 12h dimm Size: 1024 MB dimm Speed: 400 MHz dimm Status: Ok dimm dimm Cartridge #: 0 dimm Module #: 3 dimm Present: Yes dimm Form Factor: 9h dimm Memory Type: 12h dimm Size: 1024 MB dimm Speed: 400 MHz dimm Status: Ok dimm dimm Cartridge #: 0 dimm Module #: 4 dimm Present: Yes dimm Form Factor: 9h dimm Memory Type: 12h dimm Size: 1024 MB dimm Speed: 400 MHz dimm Status: Ok dimm dimm config \config Smart Array 6i in Slot 0 (Embedded)\config \config array A (Parallel SCSI, Unused Space: 0 MB)\config \config \config logicaldrive 1 (136.7 GB, RAID 1, OK)\config \config physicaldrive 1:0 (port 1:id 0 , Parallel SCSI, 146.8 GB, OK)\config physicaldrive 1:1 (port 1:id 1 , Parallel SCSI, 146.8 GB, OK)\config \status \status Smart Array 6i in Slot 0 (Embedded)\status Controller Status: OK\status Cache Status: OK\status \status \[root@mta2 plugins-scripts]#
[Reply]
lausser Reply:
June 9th, 2010 at 11:00@Nikolas Nunez, WordPress messed it up. Please send it per mail to gerhard.lausser@consol.de
[Reply]
lausser Reply:
June 9th, 2010 at 11:16@Nikolas, Now is see it. Look into the output:
So querying powersupplies is simply not supported on this type of machine (or maybe with this version of the hpasm software) You can see it withpowersupply Command NOT supported on this server at this time fans Command NOT supported on this server at this time
hpasmcli -s "show powersupply" hpasmcli -s "show fans"
[Reply]
-
sak Says:
June 8th, 2010 at 17:54hi lausser,
first, thanks for this soft. second, I have a doubt about the fans, check_hp say the fans are notRedundant:
fan 1 is present, speed is normal, pctmax is 25%, location is system, redundance is notRedundant, partner is 0 fan 2 is present, speed is normal, pctmax is 25%, location is system, redundance is notRedundant, partner is 0 fan 3 is present, speed is normal, pctmax is 47%, location is system, redundance is notRedundant, partner is 0 fan 4 is present, speed is normal, pctmax is 47%, location is system, redundance is notRedundant, partner is 0
but hpasmcli say they are redundant:
hpasmcli> show fans Fan Location Present Speed of max Redundant Partner Hot-pluggable — ——– ——- —– —— ——— ——- ————-
1 SYSTEM Yes NORMAL 25% Yes 0 Yes
2 SYSTEM Yes NORMAL 25% Yes 0 Yes
3 SYSTEM Yes NORMAL 47% Yes 0 Yes
4 SYSTEM Yes NORMAL 47% Yes 0 Yes
it’s a bug on check_hp that is flipping the boolean ?
[Reply]
lausser Reply:
June 9th, 2010 at 11:09Please look at the posting above (Nicolas Nunez) and mail me the output of the mentioned test script.
[Reply]
Nikolas Nunez Reply:
June 9th, 2010 at 12:13The output of these commands are the same as your report, powersupply and fans command NOT supported. I have compared the hpasm from other server and it’s a different version. So i’m trying to update the hpasm to be the same.
will keep you posted
[Reply]
Nikolas Nunez Reply:
June 9th, 2010 at 14:51The issues seems to be when the plugin communicates with the following hpasm file, hpasm-7.5.1-8.rhel4. I have since once again update the PSP and rebooted the server and all is fine.
[Reply]
lausser Reply:
June 10th, 2010 at 0:39I had a look at the fan-related code and i found a comment ” # cpqHeFltTolFanRedundantPartner=0: partner not avail”. I remember now, that a partner=0/redundant=yes actually means “not redundant”. It’s a bug in hpasm, which simply outputs incorrect information here. You have fans 1-4 in your system, fan 0 does not exist and can thus be no partner.
[Reply]
-
sak Says:
June 9th, 2010 at 22:46hi gerhard,
doesn ‘t check_hpasm support NICs ?
[Reply]
lausser Reply:
June 10th, 2010 at 0:16No, this is not supported. I would rather monitor interfaces at the operating system level.
[Reply]
-
Nikolas Nunez Says:
June 11th, 2010 at 12:08I have an old DL380 G2, that the plugin states the following WARNING – status of all 6 dimms is n/a (please upgrade firmware). I thought that maybe the version of the PSP was too new for this server and downgraded to the recommended version of HP. I have run the script and the following is displayed, dimm DIMM Configuration dimm —————— dimm Cartridge #: 0 dimm Module #: 1 dimm Present: Yes dimm Form Factor: 8h dimm Memory Type: 5h dimm Size: 128 MB dimm Speed: 133 MHz dimm Status: N/A dimm dimm Cartridge #: 0 dimm Module #: 4 dimm Present: Yes dimm Form Factor: 8h dimm Memory Type: 5h dimm Size: 128 MB dimm Speed: 133 MHz dimm Status: N/A dimm dimm Cartridge #: 0 dimm Module #: 2 dimm Present: Yes dimm Form Factor: 8h dimm Memory Type: 5h dimm Size: 128 MB dimm Speed: 133 MHz dimm Status: N/A dimm dimm Cartridge #: 0 dimm Module #: 5 dimm Present: Yes dimm Form Factor: 8h dimm Memory Type: 5h dimm Size: 128 MB dimm Speed: 133 MHz dimm Status: N/A dimm dimm Cartridge #: 0 dimm Module #: 3 dimm Present: Yes dimm Form Factor: 8h dimm Memory Type: 5h dimm Size: 256 MB dimm Speed: 133 MHz dimm Status: N/A dimm dimm Cartridge #: 0 dimm Module #: 6 dimm Present: Yes dimm Form Factor: 8h dimm Memory Type: 5h dimm Size: 256 MB dimm Speed: 133 MHz dimm Status: N/A
Could you please advise me what the problem may be.
[Reply]
lausser Reply:
June 11th, 2010 at 13:19Well, bad luck. As you can see from the section “Unknown memory status” in the documentation above, there are cases, where memory status cannot be aquired. (maybe it’s the bios, maybe the dimms don’t support a status at all, i don’t know). At least you can get rid of the error message with –ignore-dimms.
[Reply]
Nikolas Nunez Reply:
June 11th, 2010 at 14:54Thanks, didn’t read this. One more question, sorry for this. I have run a check hpasm -v to get the compnent so I can black list something, but the compenet numbers are not shown on the hpasm -v. Am i doing something wrong.
[Reply]
lausser Reply:
June 11th, 2010 at 15:03Please post the output inside pre-tags
[Reply]
Nikolas Nunez Reply:
June 14th, 2010 at 17:06I have emailed the output, as the last time I sent it, it wasn’t clear.
[Reply]
lausser Reply:
June 14th, 2010 at 17:14Ok, now i understand. The controller accelerator (and battery) number is the same as the controller above. (1, 2) It should work with –blacklist daac:1,2 I think blacklisting a controller accelerator also blacklists the accelerator battery. If not, use –blacklist daac:1,2/dacb:1,2checking disk subsystem da controller 1 in slot 1 is ok controller accelerator is not controller accelerator battery is notPresent da controller 2 in slot 0 is ok controller accelerator is ok controller accelerator battery is notPresent
Nikolas Nunez Reply:
June 14th, 2010 at 19:17Thanks for the information. I have applied the blacklist option but I have still an alarm in regards to the controller accelerator needing attention.
Does the alarm correspond then to the issues that the controller accelerator and controller accelerator battery is not Present.
How would it then be albe to remove the alarm.
lausser Reply:
June 14th, 2010 at 19:31Please mail me the complete output from the diagnosis script. The one you sent me (serial GB8633…) had only one controller.
Nikolas Nunez Reply:
June 14th, 2010 at 20:02Hi,
I emailed it to you before, the server S/N starts with ’7250′ and is a DL380 G2. Anyway I’ll forward it on again.
-
Markus Bloch Says:
June 11th, 2010 at 16:25Hallo, grossartiges Skript. Wir benutzen es bei uns für DL360 und DL380 von G3 – G6. Wir hatten in der Vergangenheit defekte RAM-Module mit check_hpasm erkannt und getauscht. Eine Frage, währe es möglich bei allen gecheckten Komponenten die Eckdaten bei -v anzugeben? Bsp.
[pre] dimm module 0:1 (module 1 @ cartridge 0, 1024MB 400MHz) is ok | d:0:1 dimm module 0:2 (module 2 @ cartridge 0, 1024MB 400MHz) is ok | d:0:2 dimm module 0:3 (module 3 @ cartridge 0, 1024MB 400MHz) is ok | d:0:3 dimm module 0:4 (module 4 @ cartridge 0, 1024MB 400MHz) is ok | d:0:4 dimm module 0:5 (module 5 @ cartridge 0, 512MB 400MHz) needs attention (degraded) | d:0:5 dimm module 0:6 (module 6 @ cartridge 0, 512MB 400MHz) is ok | d:0:6 dimm module 0:7 (module 7 @ cartridge 0, 512MB 400MHz) is ok | d:0:7 dimm module 0:8 (module 8 @ cartridge 0, 512MB 400MHz) is ok [/pre]
Somit kann man sofort beim HP-Support anrufen und hat Serien-Nr., defektes Teil und die Eckdaten für das Ersatzteil auf einem Bildschirm (Bsp. bei Festplatten währe da die Größe + RPM).
Das währe echt super. Weiter so!!
Grüße Markus Bloch
[Reply]


lausser Reply:
October 30th, 2009 at 11:35
That’s indeed a severe bug. Thank you for bringing this to my notice. Gerhard
[Reply]
Guenther Sommer Reply:
November 9th, 2009 at 12:21
@lausser, Is there already a fix available or workaround (patch)? Can this be done soon, I would really need this (and can’t find in the code where it gets evaluated.
[Reply]
Martin Reply:
December 1st, 2009 at 1:33
Hi Lausser,
Do you have a fix for this bug yet? It’s a great script.
[Reply]
lausser Reply:
December 1st, 2009 at 11:37
Have a look at the blog entry “check_hpasm Sneak Preview II”. This pre-release should handle it. Please try it and mail me immediately if you have problems. I wanted to release 4.0 in the next days.
[Reply]
Acid Reply:
December 4th, 2009 at 21:01
@lausser,
Hi,
I’m testing the 4.0.1 version on a dl360g4, the power supplies do not show at all :
OK – System: ‘proliant dl360 g4p’, S/N: ‘CZJ64202ST’, ROM: ‘P54 07/16/2007′, hardware working fine, da: 1 logical drives, 2 physical drives, cpu_0=ok fan_1=49% fan_2=49% temp_1=32 temp_2=37 temp_4=29 temp_5=23 checking cpus cpu 0 is ok checking power supplies checking fans fan 1 is present, speed is normal, pctmax is 49%, location is processor_zone, redundance is notRedundant, partner is 0 fan 2 is present, speed is normal, pctmax is 49%, location is system, redundance is notRedundant, partner is 0 checking temperatures 1 i/o_zone temperature is 32C (63 max) 2 cpu#1 temperature is 37C (85 max) 4 power_supply_bay temperature is 29C (48 max) 5 system_bd temperature is 23C (41 max) checking memory dimm module 0:1 (module 1 @ cartridge 0) is ok dimm module 0:2 (module 2 @ cartridge 0) is ok dimm module 0:3 (module 3 @ cartridge 0) is ok dimm module 0:4 (module 4 @ cartridge 0) is ok checking disk subsystem da controller 1 in slot 0 is ok controller accelerator is ok controller accelerator battery is notPresent logical drive 1:1 is ok (raid 1) physical drive 1:0 is ok physical drive 1:1 is ok
Acid Reply:
December 4th, 2009 at 21:21
@lausser,
Here are the output of hpasmcli and the hp-health version : hpasmcli> show powersupply Power supply #1 Present : Yes Redundant: Yes Condition: Ok Hotplug : Supported Power supply #2 Present : Yes Redundant: Yes Condition: Ok Hotplug : Supported hpasmcli> quit [root@maribor ~]# rpm -qa | grep hp-health hp-health-8.3.2.2-1
lausser Reply:
December 5th, 2009 at 15:46
Hi Acid, have a look at the script under “call to participate” above. Please mail me the output of that script.