check_logfiles

Posted on July 12th, 2009 by lausser

Beschreibung

check_logfiles ist ein Plugin für Nagios, das Logfiles auf bestimmte Muster hin durchsucht.

Motivation

Die in den offiziellen Nagios-Plugins enthaltenen Scripts sind für den Einsatz in einem unternehmenskritischen Umfeld nur bedingt geeignet. Insbesondere die fehlende Einbeziehung von rotierten Logdateien in den Suchvorgang ermöglicht das Entstehen von Lücken in der Überwachung. check_logfiles entstand, weil diese Mängel das Aus für die Ablösung eines proprietären Systems durch Nagios bedeutet hätten.

Besonderheiten

  • Erkennen von Logfile-Rotationen – Logfiles werden i.d.R jede Nacht oder bei Erreichen einer bestimmten Größe umbenannt und komprimiert. Je nach Betriebssystem und Unternehmen kommen dabei unterschiedliche Namensgebungen zum Einsatz. Findet diese Rotation zwischen zwei Läufen von check_logfiles statt, dann muss zur Vermeidung von Überwachungslücken auch die wegrotierte Logdatei untersucht werden. Die Rotation zu erkennen, die nun umbenannte Logdatei zu finden und eventuell seit dem letzten Lauf von check_logfiles hineingeschriebene Meldungen zu durchsuchen, ist das wichtigste Feature. Häufig vorkommende Rotationsstrategien sind vordefiniert, es können aber auch unternehmensspezifische Strategien (kurz: wohin und unter welchem neuen Namen wird eine Logdatei weggeschrieben) konfiguriert werden.
  • Es können mehrere Muster angegeben werden, die wiederum in Warning- und Critical-Kategorien eingeteilt sind. Es können pro Lauf auch mehrere Logfiles durchsucht werden.
  • Auslösen von Aktionen – Nagios Plugins liefern zunächst nur einen Exitcode und eine Zeile Text, welche das Resultat des Checks zusammenfasst. Es kann aber auch wünschenswert sein, bereits zur Laufzeit des Plugins bei jedem gefundenen Muster eine Aktion auszulösen, sprich ein Script zu starten. check_logfiles bietet diese Möglichkeit. Sowohl unmittelbar nach einem Treffer als auch am Beginn oder Ende der Laufzeit kann ein Script aufgerufen werden.
  • Ausnahmen – Wenn ein Muster gefunden wurde, dann kann es durchaus sein, dass es sich bei der entsprechenden Zeile im Logfile um einen ganz speziellen Fall handelt, der nicht als Fehler gezählt werden soll. Da es umständlich bis unmöglich ist, solche Ausnahmen in einem regulären Ausdruck zu formulieren, kann man zu allgemeinen Mustern spezielle Ausnahmen definieren, die einen zunächst eingeleiteten Alarm wieder rückgängig machen.
  • Schwellwerte – Es kann festgelegt werden, dass erst eine bestimmte Anzahl von gefundenen Mustern zu einem Alarm führt.
  • Protokoll – Die Trefferzeilen werden in eine Protokolldatei geschrieben, deren Dateiname in der Ausgabe von check_logfiles steht.
  • Macros – Logfilenamen und Pattern können Macros enthalten, die zur Laufzeit aufgelöst werden.
  • Performancedaten – Die Anzahl der gelesenen Zeilen, sowie der Fehler und Warnungen wird ausgegeben.
  • Windows – Das Plugin läuft sowohl unter Unix als auch unter Windows (z.b. mit StrawBerry Perl oder als eigenständige exe-Datei)

Einführung

Aufgerufen wird das Script normalerweise mit dem Parameter -f, der als Wert den Namen einer Konfigurationsdatei bekommt:

nagios$ check_logfiles --config <konfigurationsdatei>
OK - no errors or warnings

In seiner einfachsten Form kann check_logfiles aber auch alle nötigen Parameter per Kommandozeilenoptionen erhalten. Mit dieser Form des Aufrufs sind allerdings nicht sämtliche Möglichkeiten des Plugins ausschöpfbar.

nagios$ check_logfiles --tag=ssh --logfile=/var/adm/messages \
     --rotation SOLARIS \
     --criticalpattern 'Failed password for root'
OK - no errors or warnings |ssh=1722;0;0;0
 
nagios$ check_logfiles --tag=ssh --logfile=/var/adm/messages \
     --rotation SOLARIS \
     --criticalpattern 'Failed password for root'
CRITICAL - (1 errors in check_logfiles.protocol-2007-04-25-20-59-20) - Apr 25 20:59:15 srvweb8 sshd[10849]: [ID 800047 auth.info] Failed password for root from 172.16.224.11 port 24206 ssh2 |ssh=2831;0;1;0

Grundsätzlich funktioniert check_logfiles so, dass jede Logdatei bis zum Ende durchsucht wird. Die erreichte Position innerhalb der Datei wird in einem sogenannten Seekfile gespeichert. Beim nächsten Lauf von check_logfiles wird die Logdatei dann ab dieser gemerkten Position weitergelesen. Sollte es in der Zwischenzeit zu einer Rotation der Logdatei gekommen sein, dann wird auch der Rest der wegrotierten Datei durchsucht.

Dokumentation

Für die einfachsten Anwendungsfälle wird check_logfiles mit Kommandozeilenparametern aufgerufen. Komplexere Szenarien mit mehreren Pattern oder mehreren Logfiles werden durch eine Konfigurationsdatei beschrieben.

Kommandozeilenparameter

  • –tag=<bezeichner> Damit wir eine Kurzbezeichnung des Suchauftrags angegeben. Diese Bezeichnung taucht wieder in der Ausgabe des Plugins auf und dient außerdem der Unterscheidung der einzelnen Services.
  • –logfile=<dateiname> Hier wird der Name der Datei angegeben, die durchsucht werden soll.
  • –rotation=<methode> Hier wird angegeben, nach welcher Methode Logfiles rotiert werden.
  • –criticalpattern=<regexp> Ein regulärer Ausdruck, der für einen CRITICAL Exitcode sorgt, wenn er im Logfile gefunden wird.
  • –warningpattern=<regexp> Dto., nur dass in diesem Fall nur WARNING resultiert.
  • –criticalexception=<regexp> / –warningexception=<regexp> Ausnahmen, die keinen Fehler bedeuten.
  • –okpattern=<regexp> Muster, welches die Fehlerzähler zurücksetzt.
  • –noprotocol Mit dieser Option wird die Erzeugung einer Protokolldatei verhindert. Im Normalfall werden alle Treffer in eine Datei geschrieben, deren Name in der Ausgabe des Plugins genannt wird.
  • –syslogserver Mit dieser Option wird check_logfiles darauf hingewiesen, dass dies ein Syslog-Server ist, dessen Logfiles auch Einträge enthalten können, die von anderen Rechnern geschickt wurden. Dadurch wird die Suche auf Zeilen begrenzt, die vom lokalen Rechner stammen.
  • –syslogclient=<client> Mit dieser Option wird check_logfiles darauf hingewiesen, dass dies ein Syslog-Server ist, dessen Logfiles auch Einträge enthalten können, die von anderen Rechnern geschickt wurden. Dadurch wird die Suche auf Zeilen begrenzt, die vom genannten Client-Rechner stammen.
  • –sticky[=<Lebensdauer>] Sorgt dafür, daß Fehler von Lauf zu Lauf weitergereicht werden.
  • –config Mit diesem Parameter gibt man eine Konfigurationsdatei an. Den Inhalt dieser Datei beschreibt der nächste Absatz.
  • –configdir Mit diesem Parameter gibt man ein Verzeichnis an, in dem (rekursiv) weitere Konfigurationsdateien gesucht werden. Es werden nur Dateien gelesen, die auf .cfg oder .conf enden.
  • –searches=<tag1,tag2,…> Mit diesem Parameter lassen sich die Searches einschränken. Es werden nicht alle Searches in der Konfigurationsdatei ausgeführt, sondern nur diejenigen, deren Tag in der Liste genannt wird. (–selectedsearches ist auch möglich)
  • –report=[short|long|html] Mit diesem Parameter schaltet man mehrzeiligen Output ein (Default: aus). Der Wert html erzeugt eine Tabelle, die in “Service Detail” die letzten Treffer anzeigt.
  • –maxlength=[Länge] Mit diesem Parameter schneidet man lange Zeilen ab (Default: aus). Manche Programme (z.B. TrueScan) erzeugen so lange Einträge im Eventlog, daß die Ausgabe des Plugins größer als 1024 Zeichen wird. NSClient++ verwirft diese.
  • –winwarncrit Durch diesen Parameter werden Einträge im Eventlog aufgrund des Typs WARNING/ERROR bewertet (Default: aus). Ersetzt oder ergänzt warning/criticalpattern.

Format der Konfigurationsdatei

Die Variablendefinitionen in dieser Datei werden in Perl-Syntax geschrieben. Es wird unterschieden zwischen globalen Variablen, die den gesamten Lauf von check_logfiles betreffen und solchen Variablen, die einen sogenannten “search” betreffen, derer es mehrere geben kann. Ein “search” fasst zusammen, wo gesucht wird, wonach gesucht wird, welche Relevanz ein Treffer hat, welche Aktion ggf. bei einem Treffer ausgelöst wird, usw.

$seekfilesdir Ein Verzeichnis, in dem Statusdateien nach einem Lauf von check_logfiles geschrieben werden. Diese Dateien enthalten Informationen darüber, bis zu welcher Zeile eine Logdatei gelesen und untersucht wurde. Beim nächsten Lauf von check_logfiles sorgen diese Informationen dafür, dass nur die neu hinzugekommenen Zeilen in der Logdatei analysiert werden. Die Defaulteinstellung ist /tmp oder das Verzeichnis, welches bei ./configure mit with-seekfiles-dir angegeben wurde.
$protocolsdir Ein Verzeichnis, in dem check_logfiles bei jedem Lauf die gefundenen Zeilen in eine Protokolldatei schreibt (sofern dieses gewünscht ist). Die Defaulteinstellung ist /tmp oder das Verzeichnis, welches bei ./configure mit with-protocol-dir angegeben wurde.
$protocolretention Die Anzahl der Tage, die die maximale Lebensdauer einer Protokolldatei ausdrückt. Nach Verstreichen dieser Tage wird die Datei automatisch gelöscht. Die Defaulteinstellung ist 7 Tage.
$scriptpath Eine Liste von Verzeichnissen (getrennt durch Doppelpunkt (Unix) bzw. Strichpunkt (Windows)), in denen Scripts liegen, welche beim Auffinden bestimmter Muster in der Logdatei ausgeführt werden (sofern dies gewünscht ist). Die Defaulteinstellung ist /bin:/usr/bin:/sbin:/usr/sbin oder das Verzeichnis, welches bei ./configure mit with-trusted-path angegeben wurde.
$MACROS Ein Hash, in dem eigene Macrodefinitionen eingetragen werden. siehe unten.
$prescript Ein Script, welches in der Startphase von check_logfiles aufgerufen wird. Es hat noch nichts mit der späteren Suche nach Mustern zu tun, kann aber z.B. verwendet werden, um eine Applikation zum Leeren ihres Logbuffers zu zwingen. Der Macro $CL_TAG erhält den Wert “startup”. $prescriptparams, $prescriptstdin und $prescriptdelay können analog zu scriptparams, scriptstdin und scriptdelay verwendet werden.  
$postscript Ein Script, welches zum Abschluss von check_logfiles aufgerufen wird. Es kann verwendet werden, um das Gesamtergebnis des Laufs zu verarbeiten, wenn bei vielen zu erwartenden Treffern keine Einzelverarbeitung gewünscht wird. Der Macro $CL_TAG erhält den Wert “summary”. $postscriptparams, $postscriptstdin und $postscriptdelay können analog zu scriptparams, scriptstdin und scriptdelay verwendet werden.  
$options Eine Liste von Optionen, die den Einfluss von Pre- und Postscript regeln. Siehe Abschnitt “Scripts”. Mögliche Werte sind smartpostscript, supersmartpostscript, smartprescript und supersmartprescript. Mit der Option report=”short|long|html” kann man die Ausgabe des Plugins gestalten. Verwendet man report=long/html, so kann die Ausgabe des Plugins u.U. sehr lang werden. Defaultmässig wird diese nach 4096 Zeichen abgebrochen (Soviel wie ein ungepatchtes Nagios einlesen kann). Mit der Option maxlength lässt sich dieses Limit erhöhen, z.B. maxlength=8192.  
@searches Ein Array, das einen oder mehrere Einträge (Hashreferenzen) besitzt, welche die eigentliche Aufgabe von check_logfiles beschreiben. Die Schlüsselwerte für diese Hashes werden in der folgenden Tabelle beschrieben:  

Searches werden durch die folgenden Einstellungen genauer spezifiziert:

tag Ein eindeutiger Bezeichner.
logfile Der Name der Logdatei, die durchsucht werden soll.
archivedir Das Verzeichnis, in welchem sich die wegrotierten Logfiles befinden. Defaultmäßig ist das das Verzeichnis, in dem sich die Logdatei befindet.
rotation Eine der vordefinierten Methoden oder ein regulärer Ausdruck, mit deren Hilfe sich in $archivedir die rotierten Logfiles identifizieren lassen. Fehlt dieser Eintrag, dann wird davon ausgegangen, dass die Logdatei nicht wegrotiert, sondern einfach überschrieben wird.
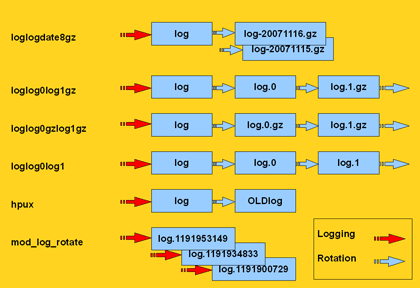
type Einer der Werte “rotating” (default, wenn rotation angegeben wurde), “simple” (default, wenn rotation fehlt), “virtual” (für Dateien, die grundsätzlich komplett durchsucht werden sollen), “errpt” (Wenn anstelle einer echten Datei die Ausgabe des errpt-Kommandos unter AIX durchsucht werden soll), “ipmitool” (Wenn das IPMI System Event Log durchsucht werden soll), “oraclealertlog” (Wenn durch eine Datenbankverbindung das Alertlog einer Oracle-DB ausgelesen werden soll) oder “eventlog”, wenn unter Windows das Eventlog durchsucht werden soll.
criticalpatterns Ein regulärer Ausdruck oder ein Array regulärer Ausdrücke. Passt ein solcher Ausdruck zu einer Zeile in der Logdatei, dann wird dies als Critical Event betrachtet. Wenn dem Ausdruck ein “!” vorangestellt wurde, dann kehrt sich die Bedeutung um. Es wird dann ein Critical Event erzeugt, wenn keine Zeile im Logfile gefunden wurde, die zu diesem Pattern passt.
criticalexceptions Ein oder mehrere reguläre Ausdrücke, welche im soeben erwähnten Fall den Event wieder in einen OK Event verwandeln. Dient z.B. dazu, um Sonderfälle abzufangen.
warningpatterns Entspricht criticalpatterns, nur dass in diesem Fall ein Warning Event erzeugt wird.
warningexceptions s.o.
okpatterns Ein regulärer Ausdruck oder ein Array regulärer Ausdrücke. Wird so ein Ausdruck gefunden, dann werden die Fehlerzähler auf Null gesetzt und alle bisher gefundenen critical/warningpatterns verworfen.
script Bei einem Treffer kann ein Script ausgeführt werden, wenn dies gewünscht ist. Es muss sich in einem der Verzeichnisse befinden, welche mit $scriptpath angegeben wurden. Die relevante Information wird per Environmentvariablen an das Script übergeben.
scriptparams Optional können an ein Script auch Kommandozeilenparameter übergeben werden. Diese können auch Macros enthalten. Wenn $script eine Codereferenz ist, dann muss $scriptparams ein Zeiger auf ein Array sein.
scriptstdin Wenn das Script Eingabe von Stdin erwartet, so kann man hier den entsprechenden String beschreiben. Dieser kann wiederum Macros enthalten.
scriptdelay Nachdem das Script beendet ist, wird eine Pause von <delay> Sekunden eingelegt, bevor check_logfiles seine Arbeit wieder aufnimmt.
options Hier kann ein String mit kommaseparierten Optionen angegeben werden. Jede Option kann mit “no” beginnen und somit das Abschalten der entsprechenden Funktionalität bewirken. Die einzelnen Optionen werden in der nächsten Tabelle beschrieben:
template Anstelle eines Tags kann auch ein Template angegeben werden. Wenn check_logfiles mit der –tag Option aufgerufen wird, dann wird der entsprechende Search ausgeführt, als sei er mit einem Tagnamen definiert worden. (Siehe Beispiele)

Optionen

[no]script Steuert, ob der script-Befehl ausgeführt wird. default: aus
[no]smartscript Steuert, ob Exitcode und Ausgabe des Scripts in die Trefferliste einfliessen sollen. default: aus
[no]supersmartscript Steuert, ob Exitcode und Ausgabe des Scripts den vorausgegangenen Treffer ersetzen sollen. default: aus
[no]protocol Steuert, ob die Treffer in einer eigenen Datei zur späteren Auswertung gespeichert werden. default: ein
[no]count Steuert, ob Treffer gezählt werden und in den Exitcode einfließen. Wenn nicht, kann check_logfiles auch nur zum Ausführen von Scripts benutzt werden. default: ein
[no]syslogserver Wird gesetzt, wenn in das Logfile auch Meldungen anderer Server einfließen. Mit syslogserver werden nur solche Zeilen betrachtet, die mit einem der Hostnamen des lokalen Hosts beginnen. default: aus
[no]syslogclient=string Dient der Vorfilterung. Es werden nur Zeilen untersucht, in denen der String vorkommt. default: aus
[no]perfdata Steuert, ob die Resultate als Performance Data angezeigt werden sollen. default: ein
[no]logfilenocry Steuert, was passiert, wenn das Logfile nicht existiert. Die Option nologfilenocry toleriert diesen Fall. Defaultmässig wäre das ein Grund für einen UNKNOWN Error. default: ein
[no]case Steuert, ob in den Suchmustern zwischen Groß- und Kleinschreibung unterschieden wird default: ein
[no]sticky[=Sekunden] Steuert, ob ein Fehler von Lauf zu Lauf weitergereicht wird. Der Exitcode von check_logfiles ist in so einem Fall auch dann != 0, wenn keine neuen Fehlermeldungen mehr im Logfile aufgetaucht sind. Der Fehlerzustand wird entweder durch ein okpattern oder nach Ablauf der angegebenen Dauer beendet. Wer nicht auf Anhieb den Sinn diese Option versteht, sollte die Finger davon lassen. default: aus
[no]savethresholdcount Steuert, ob die Trefferzähler zwischen den Läufen erhalten bleiben. Falls ja, werden Treffer solange aufaddiert, bis ein Schwellwert (criticalthreshold) erreicht wird. Andernfalls wird bei jedem Lauf von Null an hochgezählt. default: ein
[no]encoding=string Ist ein Hinweis darauf, daß das Logfile in Unicode codiert ist. (z.b. ucs-2) default: aus
[no]maxlength=zahl Sorgt dafür, daß immens lange Zeilen ab der <zahl>-ten Stelle abgeschnitten werden default: aus
[no]winwarncrit Kann anstelle von Patterns verwendet werden, um alle Events des Typs WARNING/ERROR aus dem Windows-Eventlog zu holen default: aus
[no]criticalthreshold=zahl Eine Zahl N, die bedeutet, dass jeweils erst jeder N-te Treffer als Fehler gezählt wird. default: aus
[no]warningthreshold=zahl Eine Zahl N, die bedeutet, dass jeweils erst jeder N-te Treffer als Warning gezählt wird. default: aus
[no]allyoucaneat Beim initialen Lauf (also wenn noch kein Seekfile existiert) wird die Logdatei komplett durchsucht. default: aus
[no]eventlogformat Beim Durchsuchen des Windows Eventlog wird normalerweise nur das Feld Message ausgewertet und ausgegeben. Mit dieser Option kann der Eventtext um zusätzliche Informationen (Source, EventID,..) angereichert werden. (Details findet man weiter unten) default: aus

Vordefinierte Macros

$CL_USERNAME Der Name des Users, der check_logfiles ausführt
$CL_HOSTNAME$ Der Hostname ohne Domain
$CL_DOMAIN$ Die DNS-Domain
$CL_FQDN$ Beides zusammen
$CL_IPADDRESS$ Die IP-Adresse
$CL_DATE_YYYY$ Das aktuelle Jahr
$CL_DATE_MM$ Der aktuelle Monat (1..12)
$CL_DATE_DD$ Der aktuelle Tag des Monats
$CL_DATE_HH$ Die aktuelle Stunde (0..23)
$CL_DATE_MI$ Die aktuelle Minute
$CL_DATE_SS$ Die aktuelle Sekunde
$CL_DATE_CW$ Die aktuelle Kalenderwoche (ISO 8601:1988)
$CL_SERVICEDESC$ Der Dateiname der Konfigurationsdatei ohne Extension
$CL_NSCA_SERVICEDESC$ dto.
$CL_NSCA_HOST_ADDRESS$ Die lokale Adresse 127.0.0.1
$CL_NSCA_PORT$ 5667
$CL_NSCA_TO_SEC$ 10
$CL_NSCA_CONFIG_FILE$ send_nsca.cfg
  Folgende Macros ändern ihren Wert zur Laufzeit
$CL_TAG$ Der Bezeichner des aktuellen Laufs
$CL_TEMPLATE$ Der Name des verwendeten Templates (falls in der search-Definition verwendet)
$CL_LOGFILE$ Die Datei, die durchsucht werden soll
$CL_SERVICEOUTPUT$ Die zuletzt gefundene Zeile im Logfile
$CL_SERVICESTATEID$ Der Status als Zahl 0..3
$CL_SERVICESTATE$ Der Status als Wort (OK, WARNING, CRITICAL, UNKNOWN)
$CL_SERVICEPERFDATA$ Die Performancedaten
$CL_PROTOCOLFILE$ Die Datei in die alle Treffer geschrieben werden.

Diese Macros stehen auch in Scripts, die aus check_logfiles heraus aufgerufen werden, als Environmentvariablen zur Verfügung. Dabei wird das “CL_” im Namen durch “CHECK_LOGFILES_” ersetzt. Auch auf selbstdefinierte Macros kann zugegriffen werden. Ihrem Namen wird ebenfalls “CHECK_LOGFILES_” vorangestellt.

nagios:~> cat check_logfiles.cfg
$scriptpath = '/usr/bin/my_application/bin:/usr/local/nagios/contrib';
$MACROS = {
    MY_FUNNY_MACRO => 'hihihihohoho',
    MY_VOLUME => 'loud'
};
 
@searches = (
  {
    tag => 'fun',
    logfile => '/var/adm/messages',
    criticalpatterns => 'a funny pattern',
    script => 'laugh.sh',
    scriptparams => '$MY_VOLUME$',
    options => 'noprotocol,script,perfdata'
  },
);


nagios:~> cat /usr/bin/my_application/bin/laugh.sh
#! /bin/sh
if [ -n "$1" ]; then
  VOLUME=$1
fi
printf "It is %d:%d and my status is %s\n" \
  $CHECK_LOGFILES_DATE_HH \
  $CHECK_LOGFILES_DATE_MI \
  $CHECK_LOGFILES_SERVICESTATE
 
printf "I found something funny: %s\n" "$CHECK_LOGFILES_SERVICEOUTPUT"
if [ "$VOLUME" == "Xloud" ]; then
  echo "$CHECK_LOGFILES_MY_FUNNY_MACRO" | tr 'a-z' 'A-Z'
else
  echo "$CHECK_LOGFILES_MY_FUNNY_MACRO"
fi  
printf "Thank you, %s. You made me laugh.\n" "$CHECK_LOGFILES_USERNAME"

Performancedaten

Die Anzahl der untersuchten Zeilen sowie die Anzahl der gefundenen Muster (Critical, Warning, Unknown) werden als Performancedaten an die Ausgabe des Plugins angehängt. Mit der Option “noperfdata” lässt sich dies abschalten.

nagios$ check_logfiles --logfile /var/adm/messages \
     --criticalpattern 'Failed password' --tag ssh
CRITICAL - (4 errors) - May  9 11:33:12 localhost sshd[29742] Failed password for invalid user8 ... |ssh_lines27 ssh_warnings=0 ssh_criticals=4 ssh_unknowns=0
 
nagios$ check_logfiles --logfile /var/adm/messages \
     --criticalpattern 'Failed password' --tag ssh --noperfdata
CRITICAL - (2 errors) - May  9 11:58:48 localhost sshd[29813] Failed password for invalid user8 ...

Scripts

Es besteht die Möglichkeit, zur Laufzeit von check_logfiles externe Scripts ausführen zu lassen. Das kann zu Beginn ($prescript), am Ende ($postscript) und jedesmal, wenn ein Pattern gefunden wurde (script) der Fall sein. Siehe obiges Beispiel.

Mit der Option “smartscript” werden Ausgabe und Exit Code (0-3) des Scripts wie ein Treffer in einem Logfile behandelt und fliessen in das Endergebnis ein. Die Option “supersmartscript” sorgt dafür, daß Ausgabe und Exitcode des Scripts den auslösenden Treffers ersetzen.

Pre- und Postscript können als supersmart scripts direkten Einfluss auf den Ablauf von check_logfiles nehmen. Die Option “supersmartprescript” sorgt dafür, daß check_logfiles sofort abgebrochen wird, wenn das Prescript einen Exitcode größer Null liefert. Ausgabe und Exitcode von check_logfiles entsprechen dann denen des Prescripts. Mit der Option “supersmartpostscript” kann man den Exitcode und die Ausgabe von check_logfiles durch das Postscript bestimmen lassen. Dadurch ist z.b. die Formulierung eines aussagekräftigeren Textes möglich.

Einbindung in Nagios

Wenn nur ein Service definiert ist, der check_logfiles verwendet, dann kann der Pfad zur Konfigurationsdatei direkt angegeben werden.

define service {
  service_description   check_sanlogs
  host_name              oaschgeign.muc
  check_command       check_nrpe!check_logfiles
  is_volatile           1
  check_period          7x24
  max_check_attempts    1
  ...
}
 
define command {
  command_name          check_nrpe
  command_line          $USER1$/check_nrpe -H $HOSTADDRESS$ -c $ARG1$
}
 
command[check_logfiles]=/opt/nagios/libexec/check_logfiles
     --config logdefs.cfg

Benutzen mehrere Services check_logfiles, dann sind auch mehrere Konfigurationsdateien nötig. Es wird empfohlen, diese nach den Servicenamen zu benennen. Im folgenden Beispiel würde es dann im Verzeichnis cfg.d die Dateien solaris_check_sanlogs und solaris_check_apachelogs geben.

define service {
  service_description  logfilescan
  register             0
  is_volatile          1
  check_period         7x24
  max_check_attempts   1
  ...
}
 
define service {
  service_description  solaris_check_sanlogs
  host_name            oaschgeign.muc
  check_command
       check_nrpe_arg!20!check_logfiles!cfg.d/$SERVICEDESC$
  contact_group        sanadmin
  use                  logfilescan
}
 
define service {
  service_description  solaris_check_apachelogs
  host_name            oaschgeign.muc
  check_command
       check_nrpe_arg!20!check_logfiles!cfg.d/$SERVICEDESC$
  contact_group        webadmin
  use                  logfilescan
}
 
define command {
  command_name         check_nrpe_arg
  command_line         $USER1$/check_nrpe
       -H $HOSTADDRESS$ -t $ARG1$ -c $ARG2$ -a $ARG3$
}

Der entsprechende Eintrag in der nrpe.cfg des Hosts sieht dann so aus:

[check_logfiles]=/opt/nagios/libexec/check_logfiles --config $ARG1$

Falls Windows mit nsclient++ verwendet wird, sieht der Eintrag in der NSC.ini so aus:

check_logfiles=C:\Perl\bin\perl C:\libexec\check_logfiles --config $ARG1$

Installation

  • Nach dem Auspacken des Archivs wird ./configure aufgerufen. Mit ./configure –help können Optionen angezeigt werden, die für den Bau des Plugins einige Defaulteinstellungen liefern. Diese können jedoch später mittels einer Konfigurationsdatei wieder verändert werden.
  • Achten Sie bitte insbesondere auf Linux-Systemen darauf, dass der jenige Benutzer, der check_logfiles ausführt auch tatsächlich Leserechte auf die Logfiles besitzt. Folgende Optionen beeinflussen die Erstellung des endgültigen Plugins:
  • –prefix=BASEDIRECTORY Geben Sie hier das Verzeichnis an, in dem check_logfiles liegen soll. (default: /usr/local/nagios)
  • –with-nagios-user=SOMEUSER Dieser User wird der Eigentümer der Datei check_logfiles sein. (default: nagios)
  • –with-nagios-group=SOMEGROUP Die Gruppe des check_logfiles Scripts. (default: nagios)
  • –with-perl=PATH_TO_PERL Der Pfad zum perl-Binary (default: Das perl, das im Pfad gefunden wird)
  • –with-gzip=PATH_TO_GZIP Der Pfad zum gzip-Binary. (default: Das gzip, das im Pfad gefunden wird)
  • –with-trusted-path=PATH_YOU_TRUST Der Pfad, in dem zur Laufzeit Scripts gesucht werden. (default: /sbin:/usr/sbin:/bin:/usr/bin)
  • –with-seekfiles-dir=SEEKFILES_DIR Das Verzeichnis, in dem Statusinformationen zwischen den Läufen von check_logfiles abgelegt werden. (default: /tmp)
  • –with-protocols-dir=PROTOCOLS_DIR Das Verzeichnis, in dem die Protokolldateien mit den Treffern abgelegt werden. (default: /tmp)
  • Unter Windows wird das Plugin mit perl winconfig.pl gebaut. Es ist danach in plugins-scripts/check_logfiles zu finden.
  • Hier gibt es eine Anleitung, wie man daraus dann ein Windows Binary check_logfiles.exe baut.

Durchsuchen eines Oracle-Alertlog mit dem Typ “oraclealertlog”

Wenn man das Alertlog einer Oracle-Datenbank auslesen will, aber keinen Zugang zum Betriebssystem des DB-Servers (z.b. wenn es ein Windows-Server ist oder aus Sicherheitsgründen kein Login auf einem Unix-Server möglich ist) und somit keinen Zugang zur Alert-Datei hat, dann kann diese Datei auf eine Datenbanktabelle abgebildet werden. Der Inhalt der Datei ist dann auch über einen reinen Datenbankzugang mittels SQL-Befehlen sichtbar. Gibt man in einer check_logfiles-Konfiguration den Typ “oraclealertlog” an, dann wird dieser Weg benutzt, um  die Alertdatei zu durchsuchen. Dazu sind einige zusätzliche Parameter nötig.

# extra parameters in the configuration file
@searches = ({
  tag => 'oratest',
  type => 'oraclealertlog',
  oraclealertlog => {
    connect => 'db0815',       # connect identifier
    username => 'nagios',      # database user
    password => 'hirnbrand',   # database password
  },
  criticalpatterns => [
...

Vorbereitung seitens des Datenbankadministrators

Die Abbildung von externen Dateien auf Datenbanktabellen ist seit der Version 9 möglich. Mit diesem Script wird die Datenbank entsprechend vorbereitet.

Vorbereitung seitens des Nagios Administrators

Installation der Perl-Module DBI und DBD::Oracle (http://search.cpan.org/~pythian/DBD-Oracle-1.21/Oracle.pm).

Durchsuchen des Windows-Eventlog mit dem Typ “eventlog”

Das Eventlog von Windows-Systemen kann von check_logfiles auf die gleich Art wie herkömmliche Logdateien verarbeitet werden. Jeder Event steht für eine Zeile. Dabei werden auch hier nur die Events analysiert, die seit dem letzten Lauf von check_logfiles neu hinzugekommen sind.

In der einfachsten Form sieht eine entsprechende Konfiguration so aus:

@searches = ({
  tag => 'evt_sys',
  type => 'eventlog',
  criticalpatterns => ['error', 'fatal', failed', ....
  # logfile anzugeben ist hier nicht nötig, da sinnlos.

Soll die Bewertung der Events nicht anhand von Patterns erfolgen, sondern durch die von Windows vorgegebenen Stati WARNING und ERROR, so benutzt man die Option winwarncrit.

@searches = ({
  tag => 'evt_sys',
  type => 'eventlog',
  options => 'winwarncrit',

Beim Typ eventlog ist es auch möglich, nur ganz bestimmte Events auszulesen und der Analyse zuzuführen. Dazu gibt es include- und exclude-Filter.

@searches = ({
  tag => 'winupdate',
  type => 'eventlog',
  eventlog => {
    eventlog => 'system',
    include => {
      source => 'Windows Update Agent',
      eventtype => 'error,warning',
    },
    exclude => {
      eventid => '15,16',
    },
  },
  criticalpatterns => '.*',

Diese Einstellungen sorgen dafür, dass aus dem Eventlog nur solche Events ausgelesen werden, die folgende Bedingungen erfüllen:

  • Das System-Eventlog wird geöffnet
  • Nur die Events werden gelesen, die von der Source “Windows Update Agent” stammen.
  • Nur Errors und Warnings werden gelesen.
  • Events mit den IDs 15 und 16 werden verworfen. ( Es konnte keine Verbindung mit dem Dienst “Automatische Updates” hergestellt werden )

Es ist zu beachten, dass die einzelnen include-Bedingungen UND-verknüpft und die exclude-Bedingungen ODER-verknüpft sind. Die durch Komma getrennten Listen sind immer ODER-verknüpft.

filter = ((source == "Windows Update Agent") AND ((eventtype == "error") OR (eventtype == "warning"))) 
         AND NOT ((eventid == 15) OR (eventid == 16))

Dieses Verhalten kann man ändern, indem man die Bedingung “operation” mit einem der Argumente “and” oder “or” angibt.

@searches = ({
  tag => 'winupdate',
  type => 'eventlog',
  eventlog => {
    eventlog => 'system',
    include => {
      source => 'Windows Update Agent',
      eventtype => 'error,warning',
      operation => 'or',
    },
    exclude => {
      eventid => '15,16',
    },
  },
  criticalpatterns => '.*',

Dieser Filter besagt: “Windows Update Agent” OR (“error” OR “warning”)

  type => 'eventlog',
  eventlog => {
    eventlog => 'system',                 # system (default), application, security
    include => {
      source => 'Windows Update Agent',   # die Herkunft (Source) des Events
      eventtype => 'error,warning',       # error, warning, info, success, failure
      operation => 'or'                      # die logische Verknüpfung. Default ist "and"
    },
    exclude => {
      eventid => '15,16',                  # die ID des Events
    },
  },

Auch im Commandline-Modus kann man Filter angeben.

check_logfiles --type 'eventlog:eventlog=application,include,source=Windows Update Agent,eventtype=error,eventtype=warning,exclude,eventid=15,eventid=16'

Mit einer weiteren Option ist es möglich, den Eventtext umzuformulieren. Normalerweise sieht check_logfiles beim Pattern Matching nur das Feld Message eines Events. Dieses erscheint auch in der Ausgabe des Plugins. Die Option “eventlogformat” dient dazu, auch die Felder EventType, Source, Category, Timewritten und TimeGenerated in der Ausgabe erscheinen zu lassen.

EventType: ERROR
EventID: 16
Source: W32Time
Category: None
Timewritten: 1259431241
TimeGenerated: 1259431241
Message: Der NtpClient verfügt über keine Quelle mit genauer Zeit.
  options => 'eventlogformat="%w src:%s id:%i %m"',

Mit diesen Einstellungen wird beim Auslesen des Events dessen Message so umgeschrieben, dass sie lautet:

2009-11-28T19:04:16 src:W32Time id:16 Der NtpClient verfügt über keine Quelle mit genauer Zeit.

Der Formatstring kennt folgende Platzhalter:

%t EventType
%i EventID
%s Source
%c Category
%w Timewritten
%g TimeGenerated
%m Message

Beispiele

Hier gibt es Beispiele für die verschiedensten Anwendungsfälle.

Download

check_logfiles-3.1.2.tar.gz

check_logfiles-3.1.2.zip

Externe Links

Changelog

  • 3.1.2 – 2009-12-08
    Bugfix bei der Macroauflösung in scriptparams+externes bat-file
  • 3.1.1 – 2009-12-03
    Neue (globale) Option maxlength.
  • 3.1 – 2009-11-22
    Neue option allyoucaneat. Neue Option eventlogformat. Neue (globale) Option report. Neue Filtermöglichkeiten für Eventlog.  
  • 3.0.4 – 2009-09-20 
    Anstelle eines Konfigurationsfiles kann ein encodierter String engegeben werden
  • 3.0.3.1 – 2009-09-07 
    Bug in type=eventlog, bei dem inkorrekte EventIDs aus dem System-EventLog gelesen wurden
  • 3.0.3 – 2009-08-26 
    Optimierung von type=eventlog.- Bug gefixt, bei dem –daemon sich nicht vom Terminal gelöst hat
  • 3.0.2 – 2009-07-23 
    Bugfix für –config. (Windows benutzt HOMEPATH anstatt HOME)- Bugfix in Eventlog+Tivoli (Danke Werner Breitschmid)
  • 3.0.1 – 2009-06-25 
    Bugfix in Eventlog+Tivoli 
    Vordefinierte Pattern match_them_all und match_never_ever
  • 2009-06-19 3.0 neue Parameter –service, –install, –deinstall. check_logfiles läuft jetzt als Windows-Service.
  • 2009-05-25 2.6 neue Parameter –lookback, –archivedir, –daemon, –warning/criticalthreshold. warning/criticalthresholds in options verlegt, match_them_all anstelle von .* auf der Kommandozeile
  • 2009-03-27 2.5.6.1 hab vergessen, aus der 2.5.6 Debuggingschrott zu löschen.
  • 2009-03-27 2.5.6 Bugfixes bei Oraclealertlog+sticky, neuer Parameter –macro, neuer Parameter –nocase
  • 2009-02-20 2.5.5.2 Option maxlength schneided lange Zeilen ab. Option winwarncrit benutzt Eventlog Type WARNING/ERROR anstelle von Patterns.
  • 2009-02-02 2.5.5.1 2.5.5 war Schrott.
  • 2009-01-23 2.5.5 Bugfixes, Auslesen von Windows Eventlog mit Win32, mehrzeilige Ausgabe
  • 2008-10-30 2.4.1.9 Bugfix wg. absoluten Konfigfile-Pfaden.
  • 2008-10-24 2.4.1.8 Bugfix in $scriptpath unter Windows (Danke Markus Wagner).
  • 2008-10-10 2.4.1.7 Bugfix in rotating::uniform und Macros in rotation. Bugfix in scriptparams mit $CL_TAG$. Danke Markus Wagner.
  • 2008-09-03 2.4.1.6 neuer Parameter –environment
  • 2008-08-15 2.4.1.5 syslogclient Hostnamen können case-insensitiv sein (mit nocase)
  • 2008-07-28 2.4.1.4 Bugfix in type=uniform, Scripts haben Zugriff auf einen State-Hash.
  • 2008-06-24 2.4.1.3 Bugfix (–sticky=<…>). Danke Severin Rossignol.
  • 2008-06-18 2.4.1.2 Bugfix in CL_DATE_YY
  • 2008-05-29 2.4.1.1 Archivedir kann jetzt Macros enthalten
  • 2008-05-27 2.4.1 Bugfix im sticky-Code (warningpattern konnte Critical auf Warning zurückstufen). Danke Nils Müller.
  • 2008-05-07 2.4 Support für Oracle Alertlogs per Datenbankverbindung
  • 2008-05-06 2.3.3 Option -F, mit der ganze Verzeichnisse nach Konfigdateien durchsucht werden können.
  • 2008-02-26 2.3.2.1 Bugfix wg. Perl5.10, Frickelei am Encoding
  • 2008-02-12 2.3.2 Support für IPMI System Event Log, Errpt Bugfix, ucs-2 codierte Dateien unter Windows.
  • 2007-12-27 2.3.1.2 Bugfix für sehr große Dateien, $CL_PROTOCOLFILE$, $CL_SERVICEPERFDATA$, noch mehr Kommandozeilenoptionen.
  • 2007-11-16 2.3.1.1 Bugfix im sticky-Code. Danke Marc Richter. Neue Option savethresholdcount. Danke Hannu Kivimäki.
  • 2007-10-16 2.3.1 Templates, bzip2 Archive, Scriptparam Bugfix, Thresholdzähler werden weitergereicht.
  • 2007-09-10 2.3 Bugfixes. Type errpt. Okpatterns. Optionen sticky und syslogclient. Neues Format der Performancedaten.
  • 2007-06-08 2.2.4.1 Bugfix (–searches)
  • 2007-06-06 2.2.4 Unterstützung für “virtuelle” Dateien (z.b. Linux /proc/*)
  • 2007-06-05 2.2.3 Bugfixes
  • 2007-06-02 2.2.2 Supersmart Scripts mit leerer Ausgabe werden unterstützt.
  • 2007-06-01 2.2.1 Smart scripts. Scripts können Codereferenzen sein.
  • 2007-05-21 2.1.1 Bugfixes
  • 2007-05-21 2.1 Windows wird unterstützt. Neue Option –selectedsearches. Neue Rotationsmethode mod_log_rotate.
  • 2007-05-10 2.0 Komplettes Redesign. Bessere Unterstützung nichtrotierender Logfiles. Performancedaten.

Copyright

Gerhard Laußer

Check_logfiles wird unter der GNU General Public License zur Verfügung gestellt. GPL

Autor

Gerhard Laußer (gerhard.lausser@consol.de) beantwortet gerne Fragen zu diesem Plugin.

93 Responses to “check_logfiles”

  1. Charles Says:
    October 12th, 2009 at 22:44

    How can I pass a regular expression like “ORA-(03113|24762)” as an argument for –criticalexception ? Do I have to use a config file on the client side? I’m running the check via check_nrpe on my nagios server. The whole command should be like this:

    [Mon Oct 12 16:32:48 root@gator: nagios] # /usr/local/nagios/libexec/check_logfiles –logfile=/ORACLE/clfyprod/oraadmin/bdump/alert_clfyprod.log –tag=clfyprod –criticalpattern=ORA- –criticalexception=”ORA-[03113|24761]” OK – no errors or warnings|clfyprod_lines=32 clfyprod_warnings=0 clfyprod_criticals=0 clfyprod_unknowns=0 [Mon Oct 12 16:43:35 root@gator: nagios] #

    Which as you see works from the local command line, but on my nagios server using check_nrpe it fails due to illegal metacharacters.

    [Reply]

    lausser Reply:

    Hi Charles, a config file on the remote side would be the preferred solution. But there is a very, very ugly hack which might help you. It is possible to transform the contents of a config file into a flat, encoded string and use this as the argument instead of the filename. Create a script “encodeconfig” with the following code:

    ! /usr/bin/perl -w

    if (-f $ARGV[0]) { my $contents = do { local (@ARGV, $/) = $ARGV[0]; }; $contents =~ s/([^A-Za-z0-9])/sprintf("%%%02X", ord($1))/seg; printf "%s\n", $contents; } else { printf STDERR "usage: encodeconfig \n"; }

    Then create a config file /tmp/clfyprod.cfg

    @searches = ({
      tag => 'clfyprod',
      logfile => '/ORACLE/clfyprod/oraadmin/bdump/alert_clfyprod.log',
      criticalpattern => 'ORA-',
      criticalexception => 'ORA-(03113|24761)'
    });
    

    Encode this configuration file with:

    $ ./encodeconfig /tmp/clfyprod.cfg 
    %40searches%20%3D%20%28%7B%0A%20%20tag%20%3D%3E%20%27clfyprod%27%2C%0A%20%20logfile%20%3D%3E%20%27%2FORACLE%2Fclfyprod%2Foraadmin%2Fbdump%2Falert%5Fclfyprod%2Elog%27%2C%0A%20%20criticalpattern%20%3D%3E%20%27ORA%5C%2D%27%2C%0A%20%20criticalexception%20%3D%3E%20%27ORA%5C%2D%2803113%7C24761%29%27%0A%7D%29%3B%0A
    
    Now you have an encoded string which contains your configuration. Use this as the argument for the –config parameter.

    check_logfiles --config %40searches%20.......
    

    Gerhard

    [Reply]

  2. Vitalik Says:
    October 21st, 2009 at 2:49

    In a scenario with multiple criticalpatterns/warningpatterns in on search, is there a way to return all lines if multiple lines are matched in one search with separate patterns? In other words, if there is a critical pattern “panic” and a warning pattern “scsi timeout,” configured within a same search in /var/adm/messages, and if it happened so that two matching messages were written within a second one after another, how to include both matched lines in the alert? The goal is to guarantee that all matches are displayed in the alert.

    Thanks!

    [Reply]

    lausser Reply:

    You can use the parameter “−−report long” (or the global variable $report = ‘long’; in a config file) if you want all the matches to be displayed.

    [nagios@nagsrv1 ~]$ echo "dev:0:1:2 error scsi timeout" >> /tmp/test.log
    [nagios@nagsrv1 ~]$ echo "panic: cannot read device" >> /tmp/test.log
    [nagios@nagsrv1 ~]$ check_logfiles --tag scsi --logfile /tmp/test.log \
    --warningpattern 'scsi timeout' --criticalpattern 'panic' \
    --report long
    CRITICAL - (1 errors, 1 warnings in check_logfiles.protocol-2009-10-21-09-02-02) - panic: cannot read device |scsi_lines=2 scsi_warnings=1 scsi_criticals=1 scsi_unknowns=0
    tag scsi CRITICAL
    panic: cannot read device
    dev:0:1:2 error scsi timeout
    
    If you want to display the check results only in the Nagios webinterface, you can even use “−−report html”, which will output a html table with colors.

    [Reply]

    Vitalik Reply:

    @lausser, thanks a lot, that is perfect! Overall, very impressed with the plug-in.

    [Reply]

  3. Frode Says:
    October 27th, 2009 at 3:01

    Looks good, but I think I’ve found a bug: If you have a logfile with CRLF (dos) lineendings, the search will never find the pattern you look for and always return the OK status.

    I’m seeing this on a Linux box, searching for items in a logfile that was made on a Windows box.

    Maybe I’m doing it wrong?

    [Reply]

    flo Reply:

    Same problem here – any hints?

    [Reply]

  4. Frode Says:
    October 27th, 2009 at 7:42

    Ignore my previous comment – I didn’t realise that it doesn’t process a log the first time it see it – I was deleting the .seek files as I was testing the regex I was using… Ooops. :P

    [Reply]

  5. ARPwatch – Netzwerk Anomalien schnell und einfach erkennen « ROOT ON FIRE Says:
    October 31st, 2009 at 10:04

    [...] verschiedensten Gründen nicht möglich, dann kann man die Logfileauswertung z.B. mit dem Plugin check_logfiles in eine Nagios Monitoring Umgebung [...]

  6. Ryan Kovar Says:
    November 4th, 2009 at 16:26

    Hi! I Love your check and use it extensively. I do have one question however; Is it possible to have it other than acceptable log entries? For example, if the log writes anything other than “none”, spit out a critical Example log output:

    20091103 15:31:44.52 “none” 20091103 15:32:36.10 “none” 20091103 15:36:31.89 “none” 20091103 15:37:01.25 “ReadOnly” 20091103 15:37:09.08 “none”

    Alert on Read Only

    [Reply]

    lausser Reply:

    You can reverse the pattern matching by adding an exclamation mark to the regular expression. criticalpattern => ‘!none’ should do the trick. Now you get a CRITICAL each time a line does not match “none”. Gerhard

    [Reply]

  7. Hombre Says:
    November 5th, 2009 at 23:42

    I have exactly the same problem with the type=errpt as described under the following link:

    http://www.icinga-portal.org/wbb/index.php?page=Thread&postID=103725

    Everytime I execute the script there were no patterns found, although there are lots of lines which matches the regex pattern.

    thanks for your help

    PS: my Version is: check_logfiles v3.0.4

    [Reply]

    lausser Reply:

    Hi, there’s a difference between errpt and ordinary files. When checking the latter, check_logfiles remembers the last position in “logoffset”. Errpt however is more time-based, so check_logfiles saves a timestamp in “logtime”. Edit your statefile and set logtime to 1 (not 0!!!). The next time you run check_logfiles it will scan the entire errpt. (you can watch what happens behind the scenes if you create a trace-file with “touch /tmp/check_logfile.trace; tail -f /tmp/check_logfiles.trace”. Don’t forget to delete it later)

    [Reply]

  8. Stephen Says:
    November 16th, 2009 at 20:40

    I was wondering if there is a way to check for a line position? Here is the logfile line:

    [11/12/09 10:28:32:131 EST] 0000000a TrustAssociat E com.ibm.ws.security.spnego.TrustAssociationInterceptorImpl initialize CWSPN0009

    The important character is E in the 52nd position. This application always places it in the 52nd position, but searching for E would result in all lines returning an error do to other E’s in the line such as EST. The application returns E, I, W in that position to inform of the type of error….

    Is there any way to do this with check_logfiles?

    Thanks

    [Reply]

    lausser Reply:

    What about the TrustAssociat? Does this label change or is always in the lines you’re interested in? You could use “TrustAssociat E” as criticalpattern (and “TrustAssociat W” as warningpattern).

    [Reply]

  9. Stephen Says:
    November 17th, 2009 at 15:26

    The Trust Associat is one of many applications in that group that can be in error. That was the first thing I asked the apps guys :) But according to them, they all put the severity flag at the same place….But the app name can change.

    [Reply]

    lausser Reply:

    Maybe this works: criticalpatterns => ‘\[.*?\]\s+\w+\s+\w+\s+E\s+’ It matches the datestring, the 000000a (or any other code), another word (which is the application name) and then a standalone E.

    [Reply]

  10. Michael Koeppl Says:
    November 25th, 2009 at 11:43

    Hello, ever thought about a “dryrun” parameter which did not change the offset value, so that searches can be evaluated without changing the seek file. If you would implement this feature maybe the seek file infos without the dryrun parameter should be made available in the file but with comments deactivated. So is the tester wants he can check the changes made by the run.

    [Reply]

  11. Vikas Vysetti Says:
    November 25th, 2009 at 21:14

    Hi

    I am looking to use check_logfiles on a standalone system. I just can’t figure out how to use it with nagios. It would be great if someone can help me out.

    [Reply]

  12. Norbert Says:
    December 1st, 2009 at 14:27

    Does anyone has a working spec file for check_logfiles?

    [Reply]

  13. Michal Says:
    December 2nd, 2009 at 15:40

    Hello

    i think there is a bug in report parameter (in config file)

    Im using following config file:

    $seekfilesdir = ‘/tmp’; $report = “html”;

    @searches = ( { tag => ‘PHPError’, logfile => ‘/var/log/httpd/httpd_error.$CL_DATE_YYYY$$CL_DATE_MM$$CL_DATE_DD$.log’, criticalpatterns => ‘.PHP Fatal.’, options => ‘noprotocol,noperfdata,nologfilenocry,nosavetreshholdcount,allyoucaneat’ }, );

    but im Always getting short output.

    I did some debuging and find out following:

    if ($self->get_option(‘report’) ne “short”) { $self->formulate_long_result(); }

    here is $self->get_option(‘report’) always short BUT on the same place $self->{report} is html. What could be the problem?

    In case i change the code to:

    if ($self->{report} ne “short”) { $self->formulate_long_result(); }

    check_scripts is working as expected.

    What is the reason for this please / What am I doing wrong?

    Next:

    It will be great to make my $maxlength = 1024; inside of formulate_long_result function configurable over config file.

    Thank you for your help.

    [Reply]

    lausser Reply:

    In 3.1 report has become an option. You have to move it into $option. I just published release 3.1.1, which lets you adjust the maximum output length in the config file.

    $options = "report=html,maxlength=1024";

    [Reply]

  14. Michal Says:
    December 4th, 2009 at 1:13

    It looks like that download link for 3.1.1 does not work.

    [Reply]

    lausser Reply:

    Sorry, it’s fixed now.

    [Reply]

  15. Ovidiu Says:
    December 15th, 2009 at 17:39

    Hello, nice plugin but for me it doesn’t work the criticalexception feature: @searches = ( { tag => ‘test’, logfile => ‘/tmp/test.log’, criticalpatterns => ‘ORA-’, criticalexception => ‘ORA-(03113|24761)’ }, );

    I have the version 3.1.2 when I execute echo “ORA-03113 dfafa” >> /tmp/test.log I get a critical return

    [Reply]

    lausser Reply:

    Hi, it’s criticalexception_s_, not criticalexception. It’s important to pay attention. While on the commandline you say –criticalpattern … –criticalexception …, because only one pattern is possible here. If you use a config file, you have to use the plural criticalpatterns/criticalexceptions, because you can specify a whole array of patterns. Gerhard

    [Reply]

  16. Benny Says:
    December 16th, 2009 at 19:36

    Hallo!

    Ich spreche nicht gut Deutche. :(

    Do you have an English version of this page? It contains a LOT of very useful information, but I haven’t found an English translation of it yet, and I don’t trust Babelfish’s accuracy that much.

    Thank you so much for the plugin!

    Benny

    [Reply]

    lausser Reply:

    Hi, if you write “ich spreche nicht gut Deutsch” then it’s perfect!. Do you see the english flag in the top right corner of the page? Click and you’re there. Gerhard

    [Reply]

    Benny Reply:

    @lausser, Thanks… I looked for a while, but managed to overlook that. How excellent. Thank you for the plugin and all the great documentation!

    [Reply]

  17. matejo Says:
    December 17th, 2009 at 15:45

    Hi! I have quite huge logs – sometimes they can grow over 1 GB. Is there an option to configure it so that it continuoes scan from tha last line it scanned before?

    [Reply]

    lausser Reply:

    That’s the default behaviour of check_logfiles. It scans a file until it hits the end-of-file and saves the position in the so-called seek-file (usually in /var/tmp/check_logfiles). When it runs next time, check_logfiles “remembers” this position and starts reading here. This way, only the lines which were appended between the single runs of check_logfiles are scanned. The position is also used to detect logfile rotations.

    [Reply]

    matejo Reply:

    @lausser, It seems it doesn’t work for me…. It doesn’t create any seek-files in that directory, neither in a directory if i specify it with $seekfilesdir=’/tmp/logCheck’; file permissons are OK.

    [Reply]

    matejo Reply:

    @matejo, Forgot to tell. I have created /tmp/check_logfiles.trace. And it says that it starts everytime from beginning… moving to position 0…

    [Reply]

    lausser Reply:

    Strange… can you please mail me the config file? Also please create a fresh trace-file, run check_logfiles two times and send me the trace-file too. Gerhard p.s. did you run check_logfiles as root? Maybe the seekfile(-dir) belongs to root and the nagios-user cannot write it.

    [Reply]

  18. Craig Says:
    December 17th, 2009 at 18:13

    Awesome plugin…I have it in use on several systems and having a small problem with one of them. The script takes FOREVER to run, it will eventually return accurate results. On a similliar system doing Oracle Alert log checks it will run in under 10 seconds, on the second system it takes in excess of 2-3 minutes. I checked the perl modules and versions – identical, Oracle versions – identical, OS – identical. Not sure where to go from here.

    Thanks

    [Reply]

  19. Craig Says:
    December 17th, 2009 at 18:14

    Sorry forgot to mention this is running on HPUX 11.31

    [Reply]

    lausser Reply:

    Create the file /tmp/check_logfiles.trace with touch. If this file exists, check_logfiles writes a lot of debugging stuff in it. Watch it with tail -f /tmp/check_logfiles.trace, esp. the timestamps. This might help finding out, where it hangs or spends time. Does the name resolution work correctly on this machine? In rare cases this was the reason for a hanging plugin, because check_logfiles tries to find out the hostname.

    [Reply]

  20. Carl Says:
    December 22nd, 2009 at 20:54

    Is there a way to trigger CRIT or OK based on a multiline match?

    Basically I have an application that produces a multiline entry per log entry. I want to return CRIT when a pattern is matched on the first line but only if the next line does not contain a specific string.

    I attempted to utilize the ‘okpattern’ option but this resets to OK regardless of previous real CRIT conditions.

    [Reply]

    lausser Reply:

    check_logfiles reads the logfile line by line and treats every line separately (this means, when it reads a line, it already has forgotten the previous lines). So it is not possible to use regular expressions which span several lines. What you can do is to add your own logic with a script.

    my $flag = 0;
    @searches = ({
      tag => 'carl',
      logfile => 'log.log',
      criticalpatterns => '.*',
      options => 'supersmartscript',
      script => sub {
        my $line = $ENV{CHECK_LOGFILES_SERVICEOUTPUT};
        $flag++ if $flag;
        if ($line =~ /critical phase/) { # line 1
          $flag = 1;
          return 0;
        } elsif ($flag == 2 && $line !~ /fixed/) { # line 2 and not pattern 2
          $flag = 0;
          print $line;
          return 2;
        } else { # line 2 and pattern 2 or line not following line 1
          $flag = 0;
          return 0;
        }
      },
    });

    [Reply]

  21. john Says:
    December 26th, 2009 at 7:52

    Is it possible to associate an action in the next run of check_logfiles even though there is no new lines being added to the log?

    [Reply]

    john Reply:

    @john,

    when there is no new line being added I would like to to have a logic inside “script => sub {..” Is this possible?

    @searches =( { tag => 'n', logfile => '/tmp/n.log', options => 'supersmartscript', criticalpatterns => ['ERROR', 'WARN', 'FIX'], script => sub { if ($ENV{CHECK_LOGFILES_SERVICEOUTPUT} =~ /ERROR/) { # do error logic... return 2; } elsif ($ENV{CHECK_LOGFILES_SERVICEOUTPUT} =~ /WARN/) { # do warnining logic... return 1; } elsif ($ENV{CHECK_LOGFILES_SERVICEOUTPUT} =~ /FIX/) { # do fix logic... return O; } else{ # do NO-NEW_LINE logic... # return 0, 1, 2 or 3 based on logic; } } } );

    [Reply]

    lausser Reply:

    Like (supersmart)script, which is executed after each pattern match, there is also the option supersmartpostscript. It can be used to rewrite the plugin’s output and exitcode. With a criticalpattern of ‘.*’ you can call a handlerscript after each line and increase a linecounter. If this linecounter is 0, then the supersmartpostscript can handle the “no new lines”-case. You can keep your own pattern matching, but instead of “do xx logic” you code “set xx flag”.

    my $linecounter = 0;
    my $errflag = 0; my $warnflag = 0; my $fixflag = 0;
    $options = 'supersmartpostscript';
    @searches = ....
    $postscript = sub {
      if ($linecounter == 0) {
        printf "no new lines&#92;n";
        # do no-new-lines-logic
        return 0;
      } .....
    };

    [Reply]

  22. john Says:
    December 26th, 2009 at 8:16

    I’m using the “sticky” option to preserve the last CRIT condition. I’m monitoring a variable that has 3 possible states: FIX (okpattern), WARN (warningpatterns) and ERROR (criticalpatterns). The FIX status will reset the CRIT, but also I would like to reset CRIT when the next event is a WARNING (warningpatterns). As of today, when the var. goes from CRIT to WARN check_logfiles shows

    CRITICAL – (1 errors, 1 warnings) – |s5_lines=1 s5_warnings=1 s5_criticals=1 s5_unknowns=0.

    This is misleading in my case because the variable can have only 1 state at any given time. Is there a way to do this? Thanks,

    [Reply]

  23. Harish Says:
    December 30th, 2009 at 16:20

    Hi All,

    I have installed this script on my nagios box, but while running this, I am always get “OK” status.

    Please help me.

    [nagios@Nagios libexec]$ echo “dev:0:1:2 error scsi timeout” >> /tmp/t.log [nagios@Nagios libexec]$ echo “panic: cannot read device” >> /tmp/t.log [nagios@Nagios libexec]$ ./ [nagios@Nagios libexec]$ /usr/local/nagios/libexec/check_logfiles check_logfiles –tag scsi –logfile /tmp/test.log \

    –warningpattern ’scsi timeout’ –criticalpattern ‘panic’ \ –report long OK – no errors or warnings|scsi_lines=0 scsi_warnings=0 scsi_criticals=0 scsi_unknowns=0 [nagios@Nagios libexec]$ cat /tmp/t.log dev:0:1:2 error scsi timeout panic: cannot read device

    [Reply]

    lausser Reply:

    Was this the first time you ran check_logfiles? From the scsi_lines=0 you see that 0 lines were scanned. This is normal behavior. The first run only initialises, that is, seeks the end of the logfile and saves the position reached. Then, with the next run, it will operate normally, do a fast forward to this saved position and then scan the lines which were added (or simply exit if no new lines were added). So call check_logfiles, call the 2 echo commands and call check_logfiles again. You should see a CRITICAL then.

    [Reply]

  24. Benny Says:
    December 31st, 2009 at 19:52

    I’m getting the hang of this plugin, and I’m happy that it is working the way it is.

    However, there is one gotcha… I am experimenting with using a config file to define a bunch of searches (actually, so the end users can write their own), and I notice that the alerts spit out with only the line matched, not with the log file matched.

    I guess I could write a script and use $CL_TAG, but is there something built-in that I’m missing? I’m trying to get away with a single service per host that checks all the searches the users have defined…

    Thanks!

    Benny

    [Reply]

    lausser Reply:

    Maybe you should try –report long or $options = “report=long”; in the configfile. Then you will see the matching lines grouped by tags.

    [Reply]

  25. haitauer Says:
    January 2nd, 2010 at 1:59

    Hi,

    report option (command line or config file) does not work in v3.1.2. Its always short.

    [Reply]

    lausser Reply:

    I can’t reproduce this.

    [Reply]

    haitauer Reply:

    @lausser, Hi lausser,

    /dev/shm/check_logfiles-v3.1.2.pl -t 50 -f test.conf –searches=”test-cacti-partial-snmp,test-cacti-partial-cmd” WARNING – (2 warnings) – 01/28/2010 09:49:20 AM – CMDPHP: Poller[0] Host[86] DS[1543] WARNING: Result from SNMP not valid. Partial Result: U …

    cat test.conf @searches = (

        {
                tag => 'test-cacti-partial-cmd',
                options => 'noperfdata,noprotocol,sticky=86400,nocase,report=long,maxlength=512',
                logfile => '/var/log/test-cacti/cacti.log',

            warningpatterns =&gt; [
                    'Result from CMD not valid',
            ],
            warningthreshold =&gt; 1,
    
            criticalpatterns =&gt; [
                    'Result from CMD not valid',
            ],
            criticalthreshold =&gt; 200,
    },
    
    {
            tag =&gt; 'test-cacti-partial-snmp',
            options =&gt; 'noperfdata,noprotocol,sticky=86400,nocase,report=long,maxlength=512',
            logfile =&gt; '/var/log/test-cacti/cacti.log',
    
            warningpatterns =&gt; [
                    'Result from SNMP not valid',
            ],
            warningthreshold =&gt; 1,
    
            criticalpatterns =&gt; [
                    'Result from SNMP not valid',
            ],
            criticalthreshold =&gt; 200,
    },
    

    );

    /dev/shm/check_logfiles-v3.1.2.pl -t 50 -f test.conf –searches=”test-cacti-partial-snmp,test-cacti-partial-cmd” –report long WARNING – (11 warnings) – 01/28/2010 09:50:25 AM – CMDPHP: Poller[0] Host[86] DS[1543] WARNING: Result from SNMP not valid. Partial Result: U …

    /dev/shm/check_logfiles-v3.1.2.pl -t 50 -f test.conf –searches=”test-cacti-partial-snmp,test-cacti-partial-cmd” –report=long WARNING – (2 warnings) – 01/28/2010 09:50:25 AM – CMDPHP: Poller[0] Host[86] DS[1543] WARNING: Result from SNMP not valid. Partial Result: U …

    [Reply]

  26. haitauer Says:
    January 2nd, 2010 at 19:12

    Hi,

    with check_logfiles v3.1.2 every entry read out from the eventlog is listed twice in the check_logfiles output.

    [Reply]

    lausser Reply:

    I can’t reproduce this. Maybe you have criticalpatterns so that an event matches twice?

    [Reply]

  27. haitauer Says:
    January 3rd, 2010 at 23:29

    Hi,

    how do I reverse the output of report=long or html? i.e. newest errors/warnings first … thanks.

    [Reply]

    lausser Reply:

    That’s not possible.

    [Reply]

  28. haitauer Says:
    January 5th, 2010 at 12:34

    Hi,

    is it possible to do something like this:

    exclude => { source => ‘Userenv’, eventid => ‘1085′, operation => ‘and’, },

    exclude => { source => ‘PureMessage’, eventid => ‘8′, operation => ‘and’, },

    i.e. I want to exclude some event IDs from defined source as eventIDs are not unique in windows, so I have to specify the source also to exclude things.

    [Reply]

    lausser Reply:

    No, more than one exclude key is not possible. But i understand the problem. I’ll have a look at this.

    [Reply]

  29. charleshb Says:
    January 5th, 2010 at 22:25

    What happened to English language version of this page?

    [Reply]

    lausser Reply:

    Just click on the english flag you see in the right upper corner of this page.

    [Reply]

  30. haitauer Says:
    January 6th, 2010 at 0:14

    hello? anyone awake here? :)

    [Reply]

    lausser Reply:

    Holydays. Sorry for not providing free 7×24 support. I’m writing and maintaining this software in my leisure time.

    [Reply]

  31. Gene Siepka Says:
    January 6th, 2010 at 18:19

    Hi all.. seem to be having an issue on Solaris watching /var/adm/messages.. at random times during the day I’ll get “cannot open file /var/adm/messages” and last night at 3:10am when the log rotated, seems like check_logfiles got stuck, until I got into the office and ran it manually.. Running thru NRPE if it makes any difference.. Saw this in the trace file i created:

    Wed Jan 6 03:10:03 2010: ==================== /var/adm/messages ================== Wed Jan 6 03:10:03 2010: found seekfile /usr/local/encap/nagios/var/check_logfiles._var_adm_messages.messages Wed Jan 6 03:10:03 2010: LS lastlogfile = /var/adm/messages Wed Jan 6 03:10:03 2010: LS lastoffset = 1953 / lasttime = 1262712406 (Tue Jan 5 12:26:46 2010) / inode = 67174402:384568 Wed Jan 6 03:10:03 2010: found private state $VAR1 = { ‘runcount’ => 502, ‘lastruntime’ => 1262765207 };

    Wed Jan 6 03:10:03 2010: this is not the same logfile 67174402:384568 != 67174402:382266 Wed Jan 6 03:10:03 2010: Log offset: 1953 Wed Jan 6 03:10:03 2010: looking for rotated files in /var/adm with pattern messages.*\.[0-9]+ Wed Jan 6 03:10:03 2010: archive /var/adm/messages.2 matches (modified Tue Dec 22 11:38:27 2009 / accessed Mon Jan 4 12:58:41 2010 / inode 377118 / inode changed Wed Jan 6 03:10:00 2010) Wed Jan 6 03:10:03 2010: archive /var/adm/messages.1 matches (modified Thu Dec 31 10:41:59 2009 / accessed Sun Jan 3 01:37:05 2010 / inode 384614 / inode changed Wed Jan 6 03:10:00 2010) Wed Jan 6 03:10:03 2010: archive /var/adm/messages.3 matches (modified Mon Jan 4 14:12:33 2010 / accessed Tue Jan 5 01:32:51 2010 / inode 366513 / inode changed Wed Jan 6 03:10:00 2010) Wed Jan 6 03:10:03 2010: archive /var/adm/messages.0 matches (modified Tue Jan 5 12:26:46 2010 / accessed Wed Jan 6 03:09:46 2010 / inode 384568 / inode changed Wed Jan 6 03:10:00 2010) Wed Jan 6 03:10:03 2010: archive /var/adm/messages.0 was modified after Tue Jan 5 12:26:46 2010 Wed Jan 6 03:10:03 2010: archive messages.0 cannot be opened Wed Jan 6 03:10:03 2010: although a logfile rotation was detected, no archived files were found Wed Jan 6 03:10:03 2010: stat (/var/adm/messages) failed, try access instead Wed Jan 6 03:10:03 2010: could not open logfile /var/adm/messages Wed Jan 6 03:10:03 2010: first relevant files: Wed Jan 6 03:10:03 2010: relevant files: Wed Jan 6 03:10:03 2010: nothing to do Wed Jan 6 03:10:03 2010: keeping position 1953 and time 1262712406 (Tue Jan 5 12:26:46 2010) for inode 67174402:384568 in mind

    Any ideas? This is a great plugin and seems to be the only one that can pattern match and then do exceptions for crap we dont want to be alerted on..

    [Reply]

    lausser Reply:

    The trace looks normal. Well, normal for a situation where the nagios-user cannot read the logfile. I know there are a lot of solaris-users running check_logfiles, but i never heard of a problem like this. It looks like during/a short time after the rotation, the logfiles are not world-readable. The rotation detection works. You see inode=67174402:384568. This is the device/inode of the messages file when check_logfiles was run last time. Now it’s inode has changed. The old 67174402:384568 appears also, but as that of messages.0. If check_logfiles only could open the files… How is this rotation managed? Is there something like /etc/logrotate.conf? Any chance to add some chmod to the rotation script?

    [Reply]

    Gene Siepka Reply:

    @lausser,

    Yes its /etc/logadm.conf in Solaris10. It rotates the log weekly and renames /var/adm/messages to /var/adm/messages.0, then .0 to .1 etc…

    I did a force log rotate just now and see the same results.. checked the permissions on /var/adm/messages and /var/adm/messages.0 and they are fine, nagios userid should be able to read them. Here is some more info:

    ls -la /var/adm/messages

    -rw-r—– 1 root sysadmin 0 Jan 7 11:14 /var/adm/messages

    ls -la /var/adm/messages.0

    -rw-r—– 1 root sysadmin 224 Jan 6 12:32 /var/adm/messages.0

    id -a nagios

    uid=502(nagios) gid=14(sysadmin) groups=500(nagios)

    and trace entry again:

    Thu Jan 7 11:19:01 2010: ==================== /var/adm/messages ================== Thu Jan 7 11:19:01 2010: found seekfile /usr/local/encap/nagios/var/check_logfiles._var_adm_messages.messages Thu Jan 7 11:19:01 2010: LS lastlogfile = /var/adm/messages Thu Jan 7 11:19:01 2010: LS lastoffset = 224 / lasttime = 1262799146 (Wed Jan 6 12:32:26 2010) / inode = 67174402:382266 Thu Jan 7 11:19:01 2010: found private state $VAR1 = { ‘runcount’ => 982, ‘lastruntime’ => 1262880561 };

    Thu Jan 7 11:19:01 2010: this is not the same logfile 67174402:382266 != 67174402:384476 Thu Jan 7 11:19:01 2010: Log offset: 224 Thu Jan 7 11:19:01 2010: looking for rotated files in /var/adm with pattern messages.*\.[0-9]+ Thu Jan 7 11:19:01 2010: archive /var/adm/messages.2 matches (modified Thu Dec 31 10:41:59 2009 / accessed Thu Jan 7 00:22:02 2010 / inode 384614 / inode changed Thu Jan 7 11:14:26 2010) Thu Jan 7 11:19:01 2010: archive /var/adm/messages.1 matches (modified Tue Jan 5 12:26:46 2010 / accessed Thu Jan 7 00:22:02 2010 / inode 384568 / inode changed Thu Jan 7 11:14:26 2010) Thu Jan 7 11:19:01 2010: archive /var/adm/messages.3 matches (modified Tue Dec 22 11:38:27 2009 / accessed Thu Jan 7 00:22:02 2010 / inode 377118 / inode changed Thu Jan 7 11:14:26 2010) Thu Jan 7 11:19:01 2010: archive /var/adm/messages.0 matches (modified Wed Jan 6 12:32:26 2010 / accessed Thu Jan 7 11:10:13 2010 / inode 382266 / inode changed Thu Jan 7 11:14:26 2010) Thu Jan 7 11:19:01 2010: archive /var/adm/messages.0 was modified after Wed Jan 6 12:32:26 2010 Thu Jan 7 11:19:01 2010: archive messages.0 cannot be opened Thu Jan 7 11:19:01 2010: although a logfile rotation was detected, no archived files were found Thu Jan 7 11:19:01 2010: stat (/var/adm/messages) failed, try access instead Thu Jan 7 11:19:01 2010: could not open logfile /var/adm/messages Thu Jan 7 11:19:01 2010: first relevant files: Thu Jan 7 11:19:01 2010: relevant files: Thu Jan 7 11:19:01 2010: nothing to do Thu Jan 7 11:19:01 2010: keeping position 224 and time 1262799146 (Wed Jan 6 12:32:26 2010) for inode 67174402:382266 in mind

    If it helps this is my config file. kind of lengthy, sorry for the wall of text:

    cat /usr/local/encap/nagios/etc/check_logfiles.cfg

    @searches = ( { tag => ‘messages’, logfile => ‘/var/adm/messages’, rotation => ‘SOLARIS’, criticalpatterns => [ 'pamsmb', 'offlin', 'Offlin', 'OFFLINE', 'fault', 'Fault', 'FAULT', 'fail', 'Fail', 'FAIL', 'down', 'Down', 'emerg', 'Emerg', 'EMERG', 'alert', 'Alert', 'ALERT', 'crit', 'Crit', 'CRIT', 'err', 'Err', 'ERR', 'xntpd.time reset', 'kern' ], criticalexceptions => [ 'My unqualified host name.unknown', 'WARNING.forceload', 'Command terminated on signal 9', 'sshd', 'TLD.going to UP state', 'ntpdate', 'ttsession', 'Tt_session ', 'GMT LOM time reference ', 'Automatic cleaning of', 'MQSeries.FFST', 'using kernel phase-lock loop', 'chiunix-mq.FFST record created', 'postfix.watchdog timeout', 'named.enforced delegation-only', 'Computer Associates Licensing', 'failure detection time', 'myin.incorrect password', 'kern.info.devinfo0', 'named.* dispatch .* connection reset', 'no cleaning tape available', 'postfix.timeout.status', 'LOGOUT for port id', 'itmpt0.RESCAN', 'rsync. name lookup failed', '/stage. file system full', 'IOCStatus = 804b', 'lw8. . Main, up', 'zcons.online', 'rsync error.some files could not be transferred', 'incorrect password attempt', 'WARNING pools facility is disabled', 'rsyncd.*daemon.warning', ], })

    And again, if I run the check_logfiles manually on the server it runs it correctly, notices the logfile was rotated and is happy. Starting to think maybe something is wrong running this thru NRPE.

    [Reply]

    lausser Reply:

    Maybe nrpe runs as nagios:nagios as opposed to nagios:sysadmin?

    [Reply]

    Gene Siepka Reply:

    @lausser,

    While at first I shrugged this off, knowing that the nagios user did have its primary group as “sysadmin”, same as the file permission…

    But got me thinking and actually you were right.. I had compiled nrpe before making the groupid change, and because of that the nrpe daemon was indeed running as nagios:nagios instead of nagios:sysadmin. re-compiled nrpe and rotated my log several times.. check_logfiles picked it up right away.

    Thanks for the suggestion and great plugin!

    [Reply]

  32. matejo Says:
    January 12th, 2010 at 14:09

    Hello!

    Is there an option so that the output of the plugin includes all error messages which it discoverd since last scan?

    I have used: $options = “report=long,maxlength=8192″;

    But all I see in nagios is the last out of 13 error strings it has found?

    [Reply]

    lausser Reply:

    strange… so this means you only get a single line?

    [Reply]

    matejo Reply:

    @lausser, yes… only single line…

    [Reply]

    lausser Reply:

    Do you have the latest version of the plugin? Can you mail me the config file and the command line parameters you used?

    [Reply]

    flo Reply:

    @lausser, I have the same problem. My application always logs TWO lines containing ‘ERROR’ but only the first line is useful. with my config attached below I always get the second line as output for nagios… my version is 3.1.2 the commandline includes the -f option only

    my config-file: $protocolretention = 14; $options=”report=long”; @searches = ( { tag => ‘Source’, logfile => ‘/var/icoserve/logs/Source.log’, criticalpatterns => ['.WARNING.', '.ERROR.' ], archivedir => ‘/var/icoserve/logs/archive’, rotation => ‘Source\.log\.\d+\.gz’ });

    [Reply]

    lausser Reply:

    i create some test messsges

    echo "text" >> Source.log
    echo "1ERROR1" >> Source.log
    echo "1WARNING1" >> Source.log
    echo "2ERROR2" >> Source.log
    echo "2WARNING2" >> Source.log
    
    then i call check_logfiles and i get 4 lines
    check_logfiles --config cfg.cfg
    CRITICAL - (4 errors in cfg.protocol-2010-01-22-01-16-01) - 2WARNING2 ...|Source
    _lines=5 Source_warnings=0 Source_criticals=4 Source_unknowns=0
    tag Source CRITICAL
    1ERROR1
    1WARNING1
    2ERROR2
    2WARNING2
    
    With a nagios3 you should see all the lines in the web interface. But notifications usually only show the first line, because the macro $SERVICEOUTPUT$ is used in the notification command. The long output is in $SERVICELONGOUTPUT$

  33. flo Says:
    January 14th, 2010 at 11:17

    Hi,

    I have this situation: My logfile rotation is almost like described in scheme loglog0gzlog1gz. The only difference is, that the rotation is starting with log.1.gz (log.0.gz is not created) Can I use this scheme without problems?

    For now i tried with: rotation => ‘Source\.log\.\d+\.gz’ But everytime a logfile containing errors is rotated again i get a error raised :(

    I hope you can provide any helpful hints…

    best regards flo

    p.s.: Very GREAT work!!!

    [Reply]

    lausser Reply:

    Yes, loglog0log1gz should work. Which kind of error did you get?

    [Reply]

    flo Reply:

    with “I get an error raised” I meant that check_logfiles returns critical when the error gets rotated but no new error is in the main logfile… I’ll try with loglog0log1gz and keep an eye on it. thanks anyway for providing free support here :)

    [Reply]

    lausser Reply:

    create the file /tmp/check_logfiles.trace and watch it with “tail -f /tmp/check_logfiles.trace” while the plugin is running. You will see some debugging output which might shed light on this.

    [Reply]

  34. Sergio Guzman Says:
    January 25th, 2010 at 21:52

    Hi, Great product!!! I’m trying to work with a Windows share mounted in Linux where I run check_logfiles against files created by Windows, the problem I have is that the “devino” value keeps changing but is the same file. It’s working ok, with an old version of Linux (2.6.17) but in (2.6.29) it keeps changing the devino, do you any idea what can I do?

    Maybe modifying the plugin so it ignores the devino and and treats the file as the same file?

    Thanks in advance for any help you can give me.

    [Reply]

    lausser Reply:

    Ignoring devino would render the plugin completely useless, as the rotation detection depends on this value. I have no idea what has changed in the linux kernel, but maybe there is a mount option to get the old behavior?

    [Reply]

    Sergio Guzman Reply:

    @lausser, The log file in this case is created once per day and it’s called MQlog-1.27.2010.log so there should be no problem ignoring the rotation as the file changes every day, I have the file called:

    logfile => ‘/mnt/shares/logs/MQlog-$CL_DATE_mm$.$CL_DATE_dd$.$CL_DATE_YYYY$.log’

    (I modified your plugin to have this new variables)

    CL_DATE_mm => 1 -> January CL_DATE_dd => 9 instead of 09

    Thanks, Sergio,

    [Reply]

    lausser Reply:

    Ah, ok. Instead of modifying the plugin (which you have to repeat with every new release) you could also create the logfilename in the configfile. my($sec, $min, $hour, $mday, $mon, $year) = (localtime)[0, 1, 2, 3, 4, 5]; $logfile = sprintf “MQlog-%d.%d.%d.log”, …

    and then in the @search logfile => $logfile

    [Reply]

  35. Coda Says:
    January 29th, 2010 at 13:26

    Hello lausser! I really love your script!

    I have a quick question that I’m trying to figure out: If I use a config file with multiple searches, Is there any way to use the ‘–logfile=’ parameter (on the command line) instead of setting it in the config file?

    I mean, I execute your script remotely, and I have many oracle alert logs from different servers that I would like to check, but they are all not located in the same directory, so I would like to use the same config file (multiple searches) and be able to specify the logfile name from command line.. Is that possible?

    Bests Regards, and sorry for my poor english.. Pablo.

    [Reply]

    lausser Reply:

    Sorry, there is no way to mix a config file and command line parameters. You might consider to write a little perl code in the config file where you set a $logfile variable .

    foreach ("/path1/alertlog", "/path2/alertlog",...) {
        $logfile = $_ if -f $_;
    }
    @searches = ({
        logfile => $logfile,
    ...
    Somehow you have to find out, which is the correct logfile path for the machine, check_logfiles is running on.

    [Reply]

  36. Matt Hawkins Says:
    February 1st, 2010 at 23:15

    Lausser,

    This is a great plugin and I use it a lot.

    I was wondering if there is an option to limit the amount of lines written to the protocol file. This would help in situations where there are thousands of match lines being written to the protocol file and it can fill up the /tmp file system if not caught in time.

    Matt

    [Reply]

    lausser Reply:

    I understand, but…no, there is no such limit. But you could set the $protocolretention parameter to 1 (default is 7), so protocolfiles older than 1 day will be deleted automatically.

    [Reply]

  37. Matt Hawkins Says:
    February 2nd, 2010 at 18:42

    Lausser,

    Thanks for the response.

    Matt

    [Reply]

  38. Ben Says:
    February 3rd, 2010 at 4:23

    Hi, I have an odd application that uses log file rotation (appends .0 .. .9) but doesn’t have a main log file. That means that it just overwrites the .1, .2, …. files so the only way to know which is the current log file is to sort by date. Do you have any advice for how to handle that? I’m running on windows but i could set up a script if you give me an idea how to do it. Thanks!!

    [Reply]

  39. lausser Says:
    February 3rd, 2010 at 17:35

    You mean there is always a fixed set of files (x.0, x.1, x.2,…) and you application just selects one of them, overwrites it and after a certain amount of time/lines it overwrites another one?

    [Reply]

    Ben Reply:

    @lausser, yes it’s a “ring” where it goes from .9 to .0, .1,…. .9, .0,.1 etc and the only way to know which one is the current one is to sort by date.

    i can’t notice a pattern in file changes, neither file size nor file date (when files are switched) have any logic. it’s just jumping to the next .X file after “a while” and it usually goes through a few files per day.

    [Reply]

    Ben Reply:

    @Ben, i noticed that this DOS command will list my logs by date: dir /o:d /t:w /b “C:\myapp\log\log*” but i’m not sure how to make it work inside the config file. i tried foreach (dir /o:d /t:w /b "C:\myapp\log\log*") { $logfile = $_ if -f $;} but this doesn’t work and fails with errors: Use of uninitialized value in pattern match (m//) at script/check_logfiles line 1183. Use of uninitialized value $[0] in substitution (s///) at C:/strawberry/perl/li b/File/Basename.pm line 338. fileparse(): need a valid pathname at script/check_logfiles line 1993

    Help is appreciated. Thanks!!

    [Reply]

    Ben Reply:

    @Ben, i’m sorry, the command inside the “foreach” is enclosed in backticks but they were stripped by the board apparently.

    [Reply]

    lausser Reply:

    Try this:

    $tracefile = 'C:\TEMP\check_logfiles.trace';
    @searches = ({
      type => 'rotating::uniform',
      # this is a regexp, thats why you need double backslashes
      rotation => 'C:\\myapp\\log\\log\.\d+',
      # no logfile => necessary
    });
    This should do what you intend. Always the file with the newest modification time is the current logfile. Please create an empty file C:\TEMP\check_logfiles.trace and have an eye on it. As long as this file exists, check_logfiles writes debugging informations in it. You will see what goes on behind the scenes. (Change the tracefile parameter in the config file if you prefer another path).

    [Reply]

    Ben Reply:

    @lausser, Thanks for the reply! i tried this but it’s not working, i’m getting errors for some reason…

    Use of uninitialized value in pattern match (m//) at script/check_logfiles line 1183. Use of uninitialized value $_[0] in substitution (s///) at C:/strawberry/perl/lib/File/Basename.pm line 338. fileparse(): need a valid pathname at script/check_logfiles line 1993

    [Reply]

    lausser Reply:

    Please make a DIR C:\myapp\log I’d like to know which files exist, their timestamps and size. If it’s not well formatted in a response posting here, please mail me the output.

    [Reply]

    Ben Reply:

    @lausser, Hi, here’s the dir C:\myapp\log as you requested: 02/08/2010 11:00 AM 98 log.0 02/08/2010 11:11 AM 100 log.1 02/08/2010 11:05 AM 99 log.2 02/08/2010 11:02 AM 100 log.3 4 File(s) 397 bytes This is on a test machine so the log files are just dummy ones. The trace file is not created and i’m only using the exact code you provided earlier for the config file. Thanks again for taking the time!

Leave a Reply